Load packages
library(nat.ggplot)
library(ggplot2)
library(dplyr)
#>
#> Attaching package: 'dplyr'
#> The following objects are masked from 'package:stats':
#>
#>     filter, lag
#> The following objects are masked from 'package:base':
#>
#>     intersect, setdiff, setequal, union
1 — How to make a basic neuron plot
A minimal 2D view of neuron meshes with a predefined rotation matrix.
nat.ggplot::ggneuron(banc.meshes, rotation_matrix = banc_view)
#> Warning in rgl.init(initValue, onlyNULL): RGL: unable to open X11 display
#> Warning: 'rgl.init' failed, will use the null device.
#> See '?rgl.useNULL' for ways to avoid this warning.
#> Registered S3 method overwritten by 'nat':
#>   method             from
#>   as.mesh3d.ashape3d rgl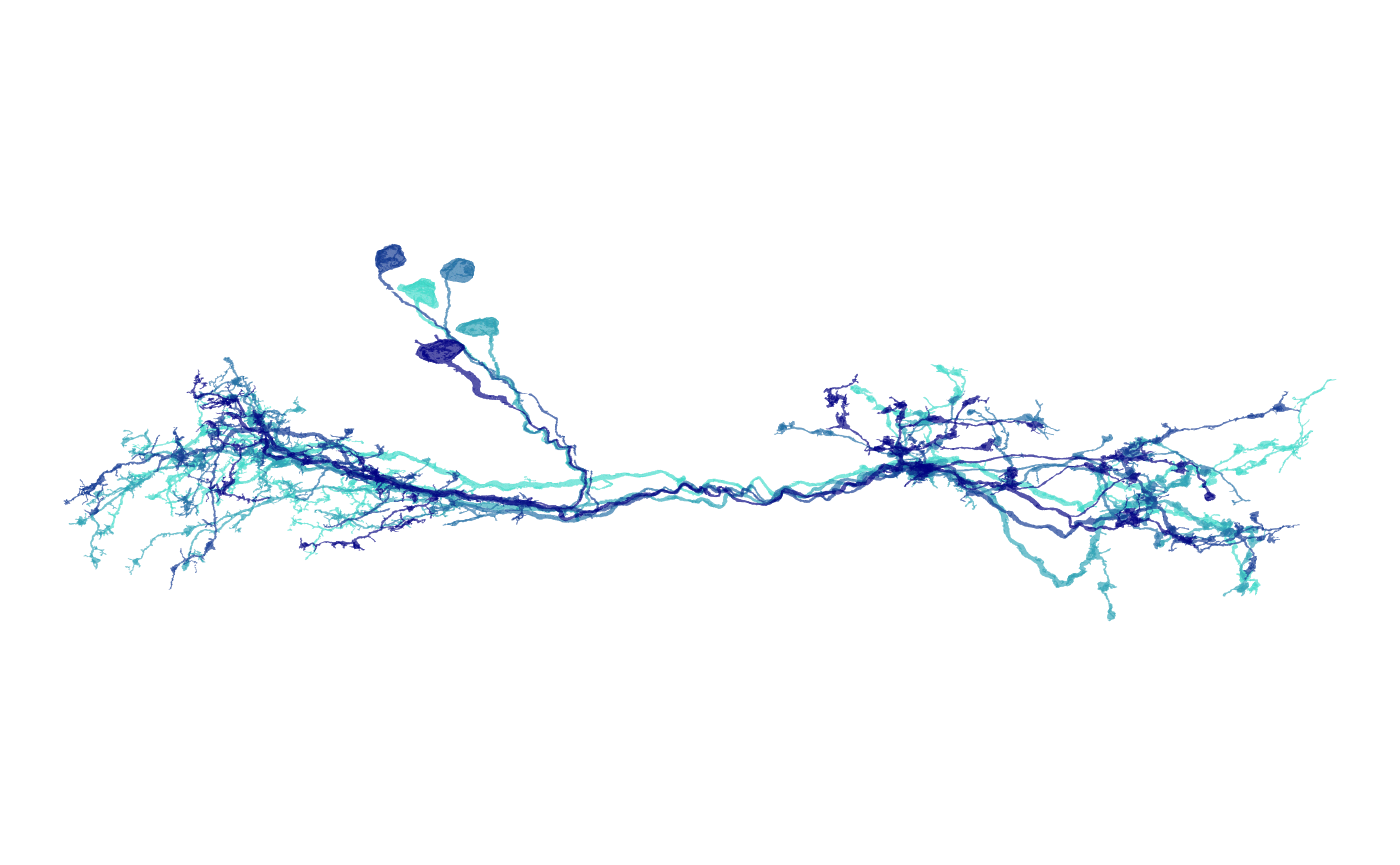
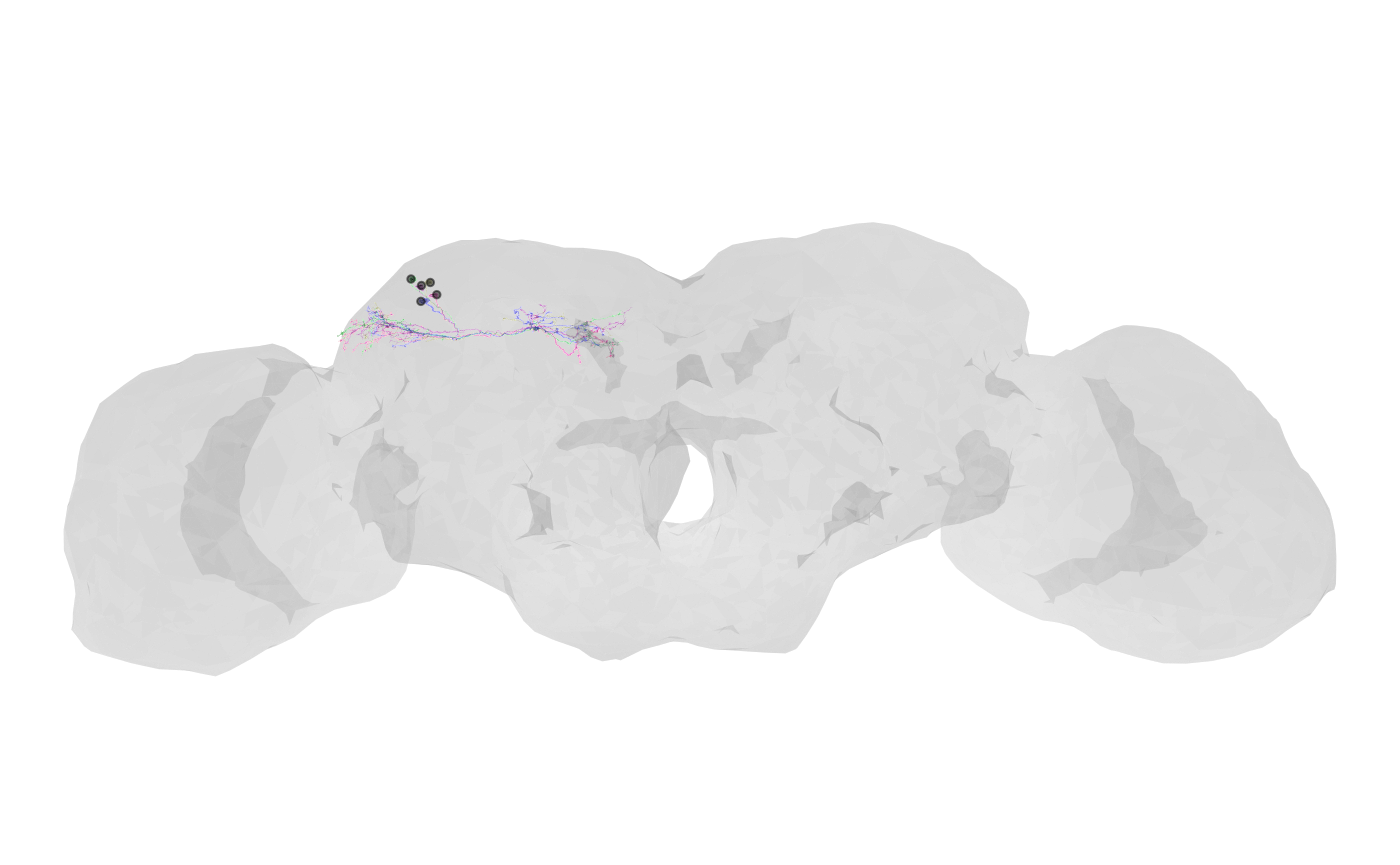
2 — How to make a layered context plot (brain + meshes + skeleton roots)
Layer meshes, a brain outline, and smoothed skeletons.
# Smooth skeletons for presentation
banc.skels_smoothed <- nat::nlapply(banc.skels, nat::smooth_neuron, sigma = 5000)

nat.ggplot::gganat +
  nat.ggplot::geom_neuron(
    banc.brain_neuropil,
    rotation_matrix = banc_view,
    cols = c("grey90", "grey60"),
    alpha = 0.3
  ) +
  nat.ggplot::geom_neuron(
    banc.meshes,
    rotation_matrix = banc_view,
    cols = c("#6D2C7B", "#FF1493", "green", "blue"),
    alpha = 0.3
  ) +
  nat.ggplot::geom_neuron(
    banc.skels_smoothed,
    size = 0.01,
    alpha = 0.5,
    root = 1,
    rotation_matrix = banc_view,
    cols = "black"
  )
3 — How to capture a 3D view and reuse it in 2D (interactive; optional)
Use nat::plot3d() and rgl to rotate
interactively, then capture the view. Disabled during build.
if (requireNamespace("rgl", quietly = TRUE)) {
nat::plot3d(banc.brain_neuropil, alpha = 0.3, col = "grey")
nat::plot3d(banc.skels_smoothed)
my_view <- nat.ggplot::rgl_view()
nat.ggplot::ggneuron(banc.skels_smoothed, rotation_matrix = my_view$userMatrix)
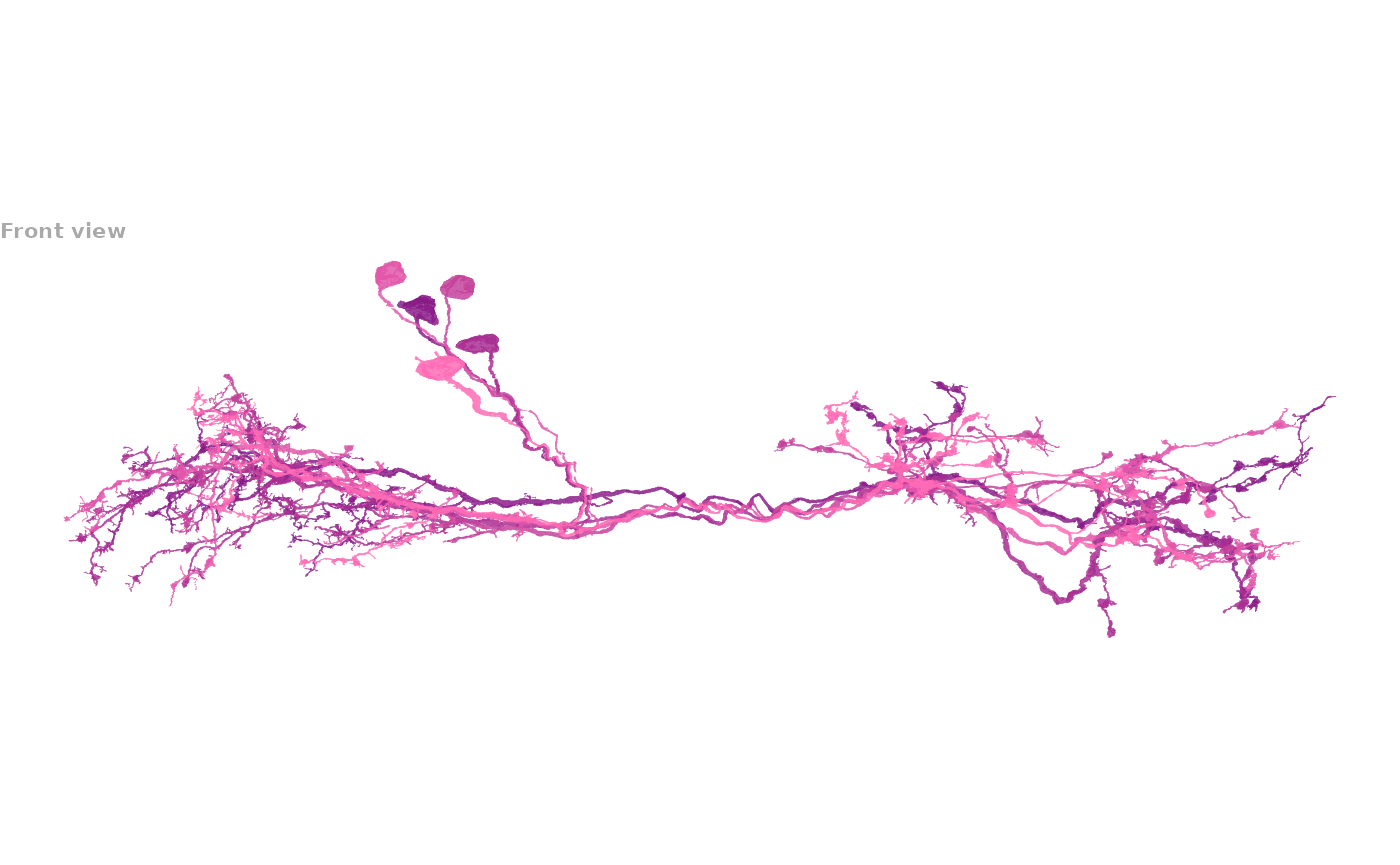
}4 — How to make fixed ‘front/side/dorsal/ventral’ views
Define rotation matrices and reuse them to render consistent views.
views <- list(
  side = structure(c(0.000764884985983372, 0.0153511334210634,
    -0.99988180398941, 0, -0.940421104431152, -0.339961022138596,
    -0.00593886896967888, 0, -0.340011894702911, 0.94031423330307,
    0.0141764245927334, 0, -401395.405539944, -128785.809090088,
    -5607.3408203126, 1), dim = c(4L, 4L)),
  front = structure(c(0.99931389093399, 0.0139970388263464,
    -0.0342894680798054, 0, -0.0321401171386242, -0.132316529750824,
    -0.990686297416687, 0, -0.0184037387371063, 0.991108655929565,
    -0.131775915622711, 0, 0, 0, 0, 1), dim = c(4L, 4L)),
  dorsal = structure(c(0.840221107006073, 0.537661552429199,
    -0.0703445374965668, 0, -0.541468024253845, 0.838866174221039,
    -0.0558210015296936, 0, 0.0289968233555555, 0.0849913582205772,
    0.9959596991539, 0, 0, 0, 0, 1), dim = c(4L, 4L)),
  ventral = structure(c(0.945645987987518, -0.325197845697403,
    3.18996608257294e-05, 0, -0.30071958899498, -0.874427616596222,
    0.380715191364288, 0, -0.123779848217964, -0.360031485557556,
    -0.924692392349243, 0, 0, 0, 0, 1), dim = c(4L, 4L))
)

nat.ggplot::ggneuron(
  banc.meshes,
  rotation_matrix = views$front,
  cols1 = c("#8B1A89", "#FF69B4"),
  cols2 = c("grey95", "grey85"),
  alpha = 0.8,
  info = "Front view"
)
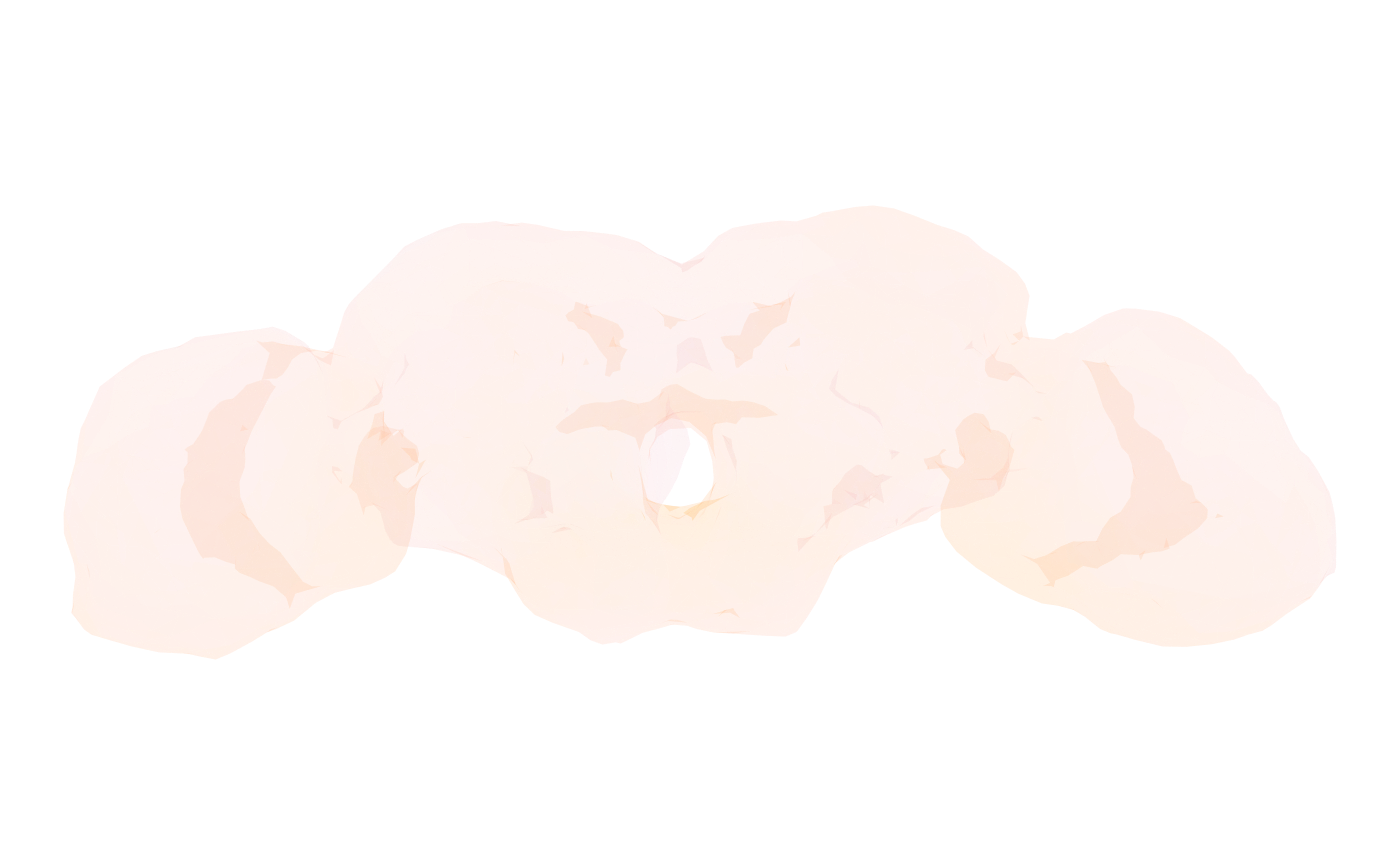
5 — How to make a brain neuropil backdrop
Render the neuropil mesh as a translucent context layer.
nat.ggplot::ggneuron(
  banc.brain_neuropil,
  rotation_matrix = banc_view,
  cols1 = c("orange", "#EFC7E6"),
  alpha = 0.1
)
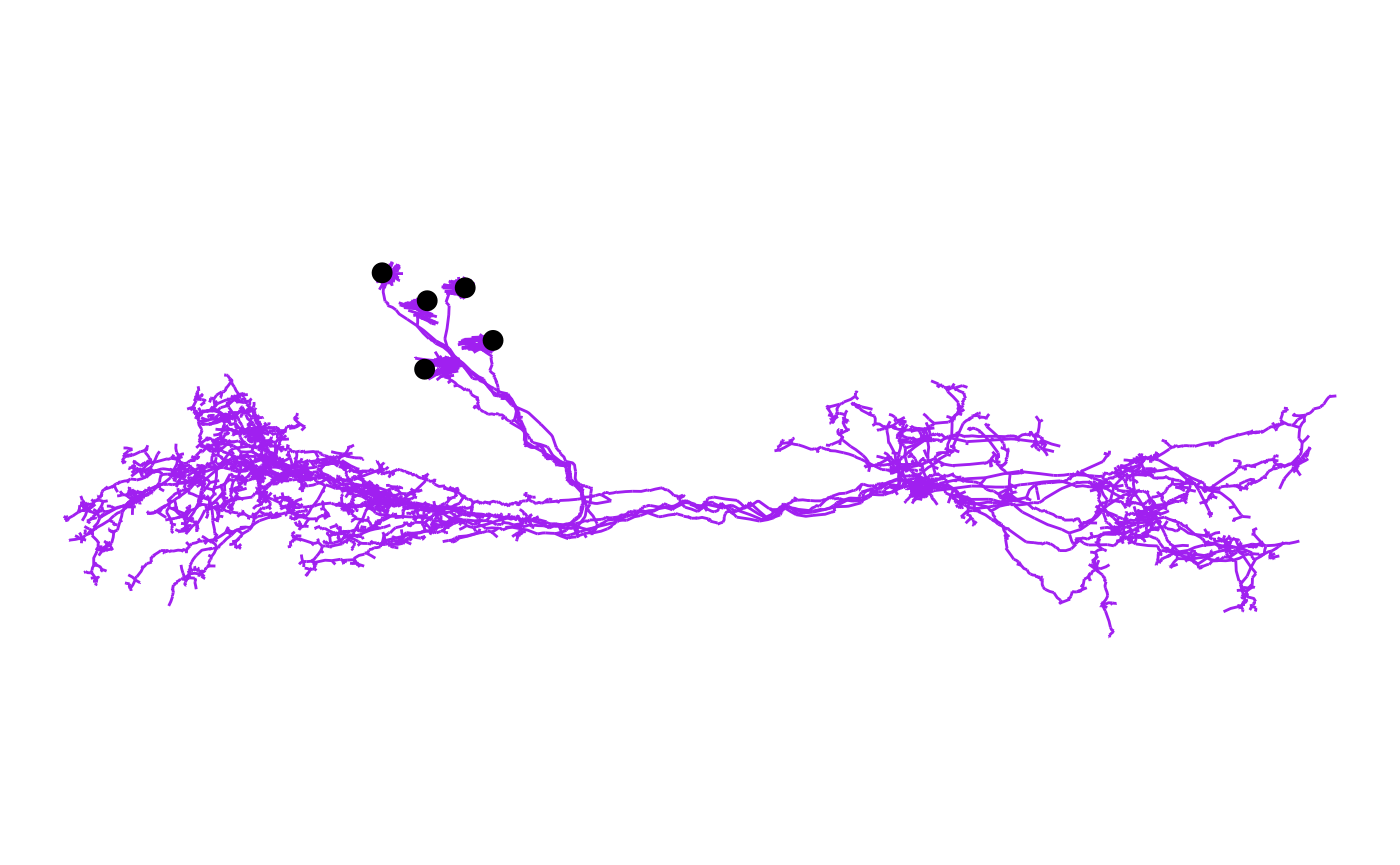
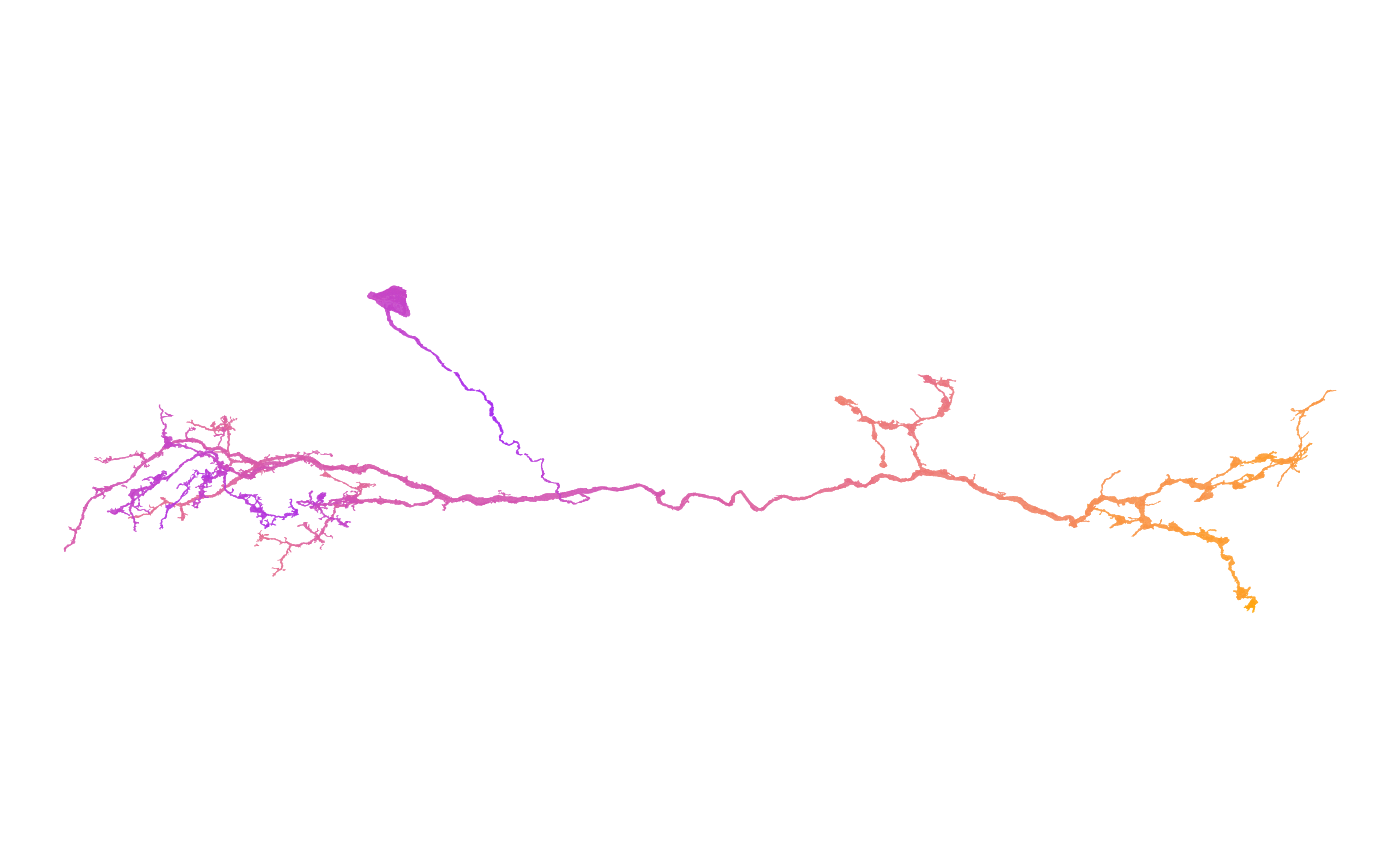
6 — How to make neuron plots with custom colours
Single colour, gradient, and per-neuron palettes.
# Single colour
nat.ggplot::gganat +
  nat.ggplot::geom_neuron(
    banc.skels_smoothed,
    rotation_matrix = banc_view,
    cols = "purple"
  )
# Gradient along arbour / depth
nat.ggplot::gganat +
  nat.ggplot::geom_neuron(
    banc.meshes[1],
    rotation_matrix = banc_view,
    cols = c("purple", "orange")
  )
# Distinct colours per neuron
neuron_colours <- c("#FF6B6B", "#4ECDC4", "#45B7D1", "#FFA07A", "#98D8C8")

nat.ggplot::gganat +
  nat.ggplot::geom_neuron(
    banc.brain_neuropil,
    rotation_matrix = banc_view,
    cols = c("grey95", "grey80"),
    alpha = 0.2
  ) +
  nat.ggplot::geom_neuron(
    banc.skels_smoothed,
    rotation_matrix = banc_view,
    cols = neuron_colours
  )
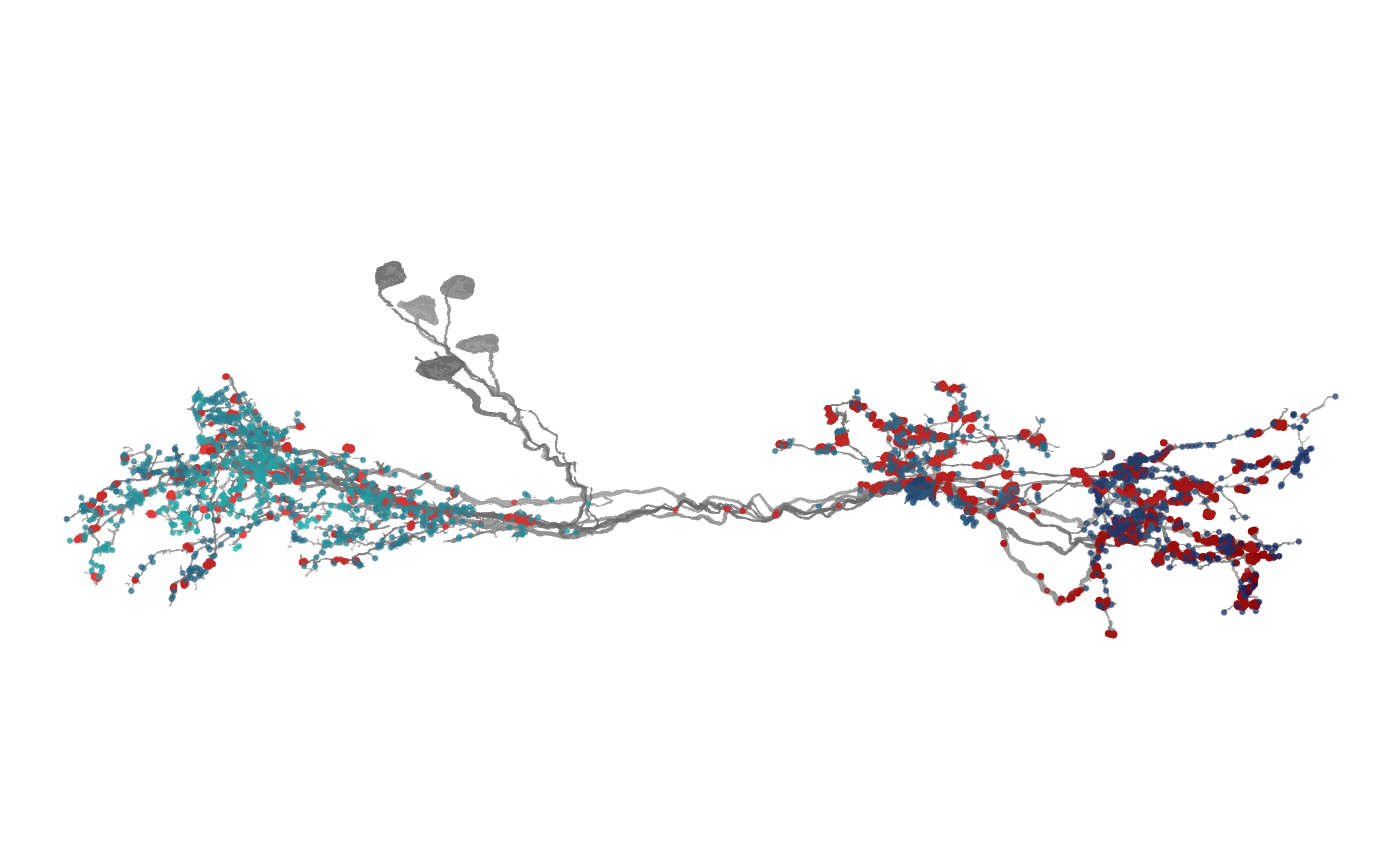
7 — How to make a synapse plot (inputs vs outputs)
Overlay synaptic sites as points; separate by prepost (0
= outputs, 1 = inputs).
syns_pre  <- dplyr::filter(banc.syns, prepost == 0)
syns_post <- dplyr::filter(banc.syns, prepost == 1)

nat.ggplot::gganat +
  nat.ggplot::geom_neuron(
    banc.meshes,
    rotation_matrix = banc_view,
    cols = c("grey60", "grey40"),
    alpha = 0.8
  ) +
  nat.ggplot::geom_neuron(
    syns_pre,
    rotation_matrix = banc_view,
    root = 0.5,
    cols = c("#EE4244", "#8B0000"),
    alpha = 0.6
  ) +
  nat.ggplot::geom_neuron(
    syns_post,
    rotation_matrix = banc_view,
    root = 0.5,
    cols = c("#1BB6AF", "#121B56"),
    alpha = 0.6
  )
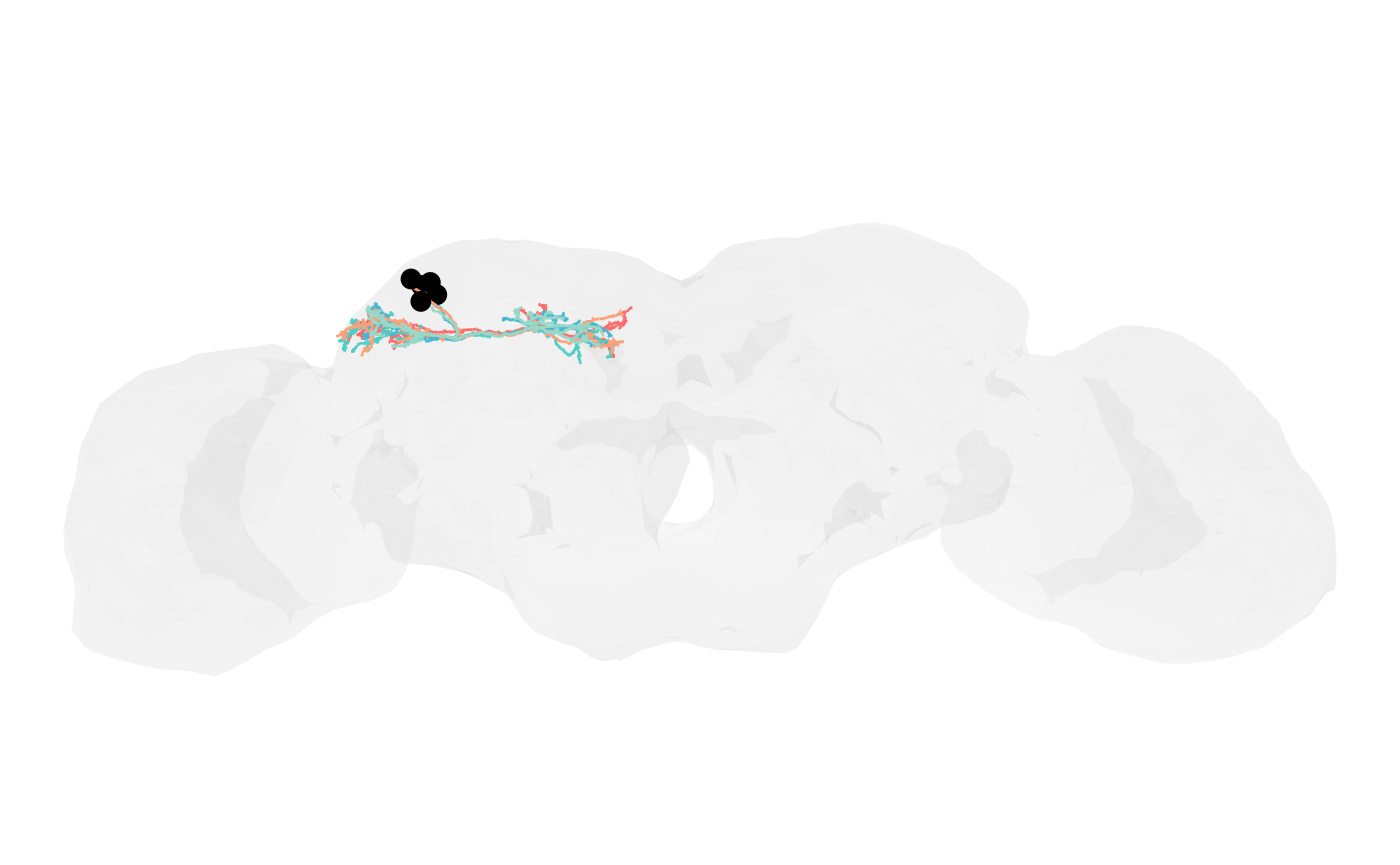
8 — How to make an axon–dendrite split plot
Colour compartments using flow-centrality-based identities.
# Single neuron
nat.ggplot::ggneuron(
  banc.neurons.flow[[1]],
  threshold = 20000,
  rotation_matrix = banc_view,
  info = paste("neuron:", names(banc.neurons.flow)[1])
)
#> Warning in nat::stitch_neurons_mst(dendrites, threshold = threshold): Could not
#> connect two vertices as edge length40570.11 is above threshold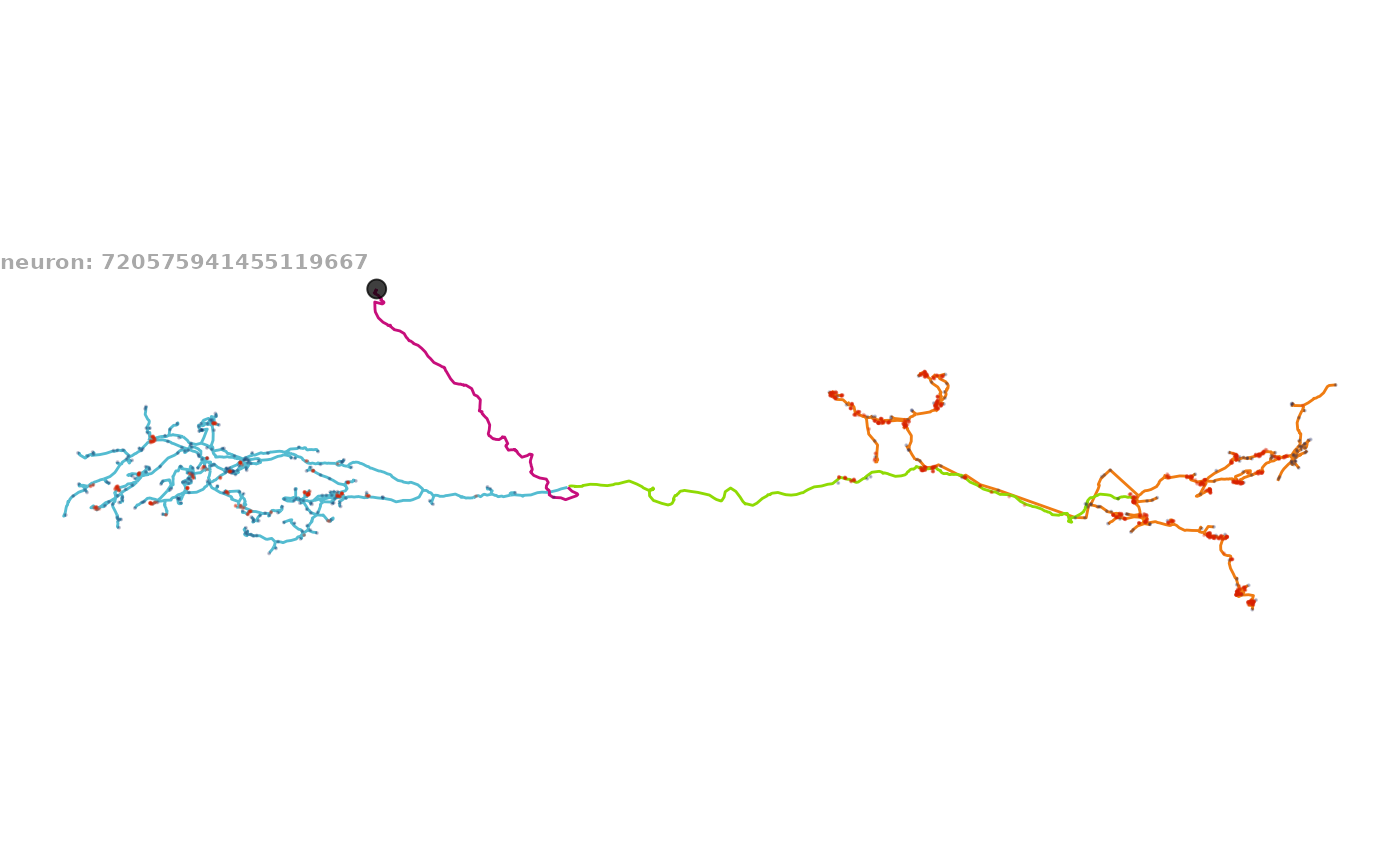
# Multiple neurons (with optional brain volume)
nat.ggplot::ggneuron(
  banc.neurons.flow,
  # volume = banc.brain_neuropil,
  threshold = 20000,
  rotation_matrix = banc_view,
  info = "LHPD2a1 neurons:\n axon (orange), dendrite (cyan), primary neurite (purple), linker (green)\n inputs (navy), outputs (red)"
)
#> Warning in nat::stitch_neurons_mst(dendrites, threshold = threshold): Could not
#> connect two vertices as edge length40570.11 is above threshold
#> Warning in nat::stitch_neurons_mst(dendrites, threshold = threshold): Could not
#> connect two vertices as edge length48970.73 is above threshold
#> Warning in nat::stitch_neurons_mst(dendrites, threshold = threshold): Could not
#> connect two vertices as edge length52407.35 is above threshold
#> Warning in nat::stitch_neurons_mst(dendrites, threshold = threshold): Could not
#> connect two vertices as edge length49254.28 is above threshold
#> Warning in nat::stitch_neurons_mst(dendrites, threshold = threshold): Could not
#> connect two vertices as edge length27245.48 is above threshold
#> Warning in nat::stitch_neurons_mst(dendrites, threshold = threshold): Could not
#> connect two vertices as edge length25094.17 is above threshold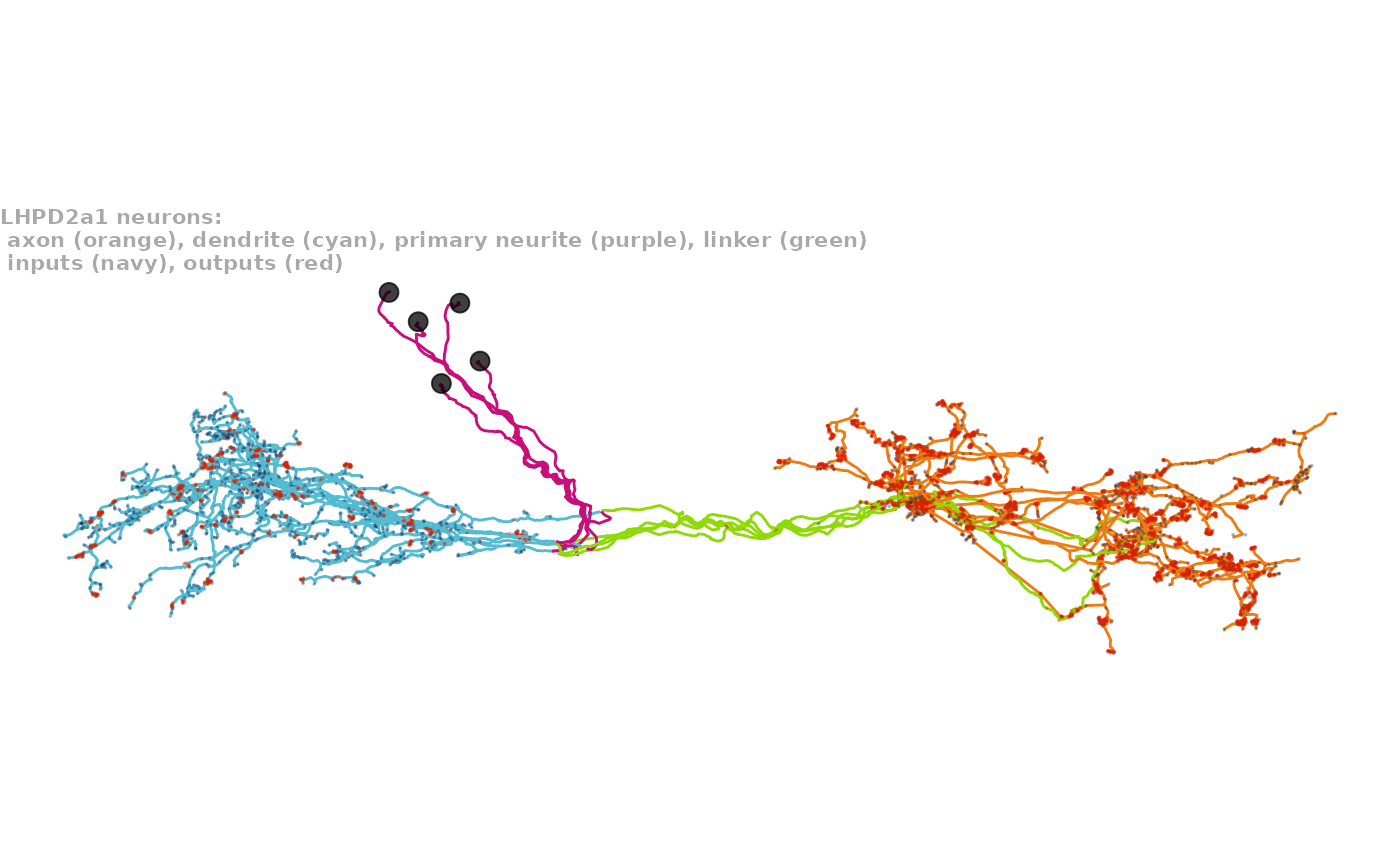
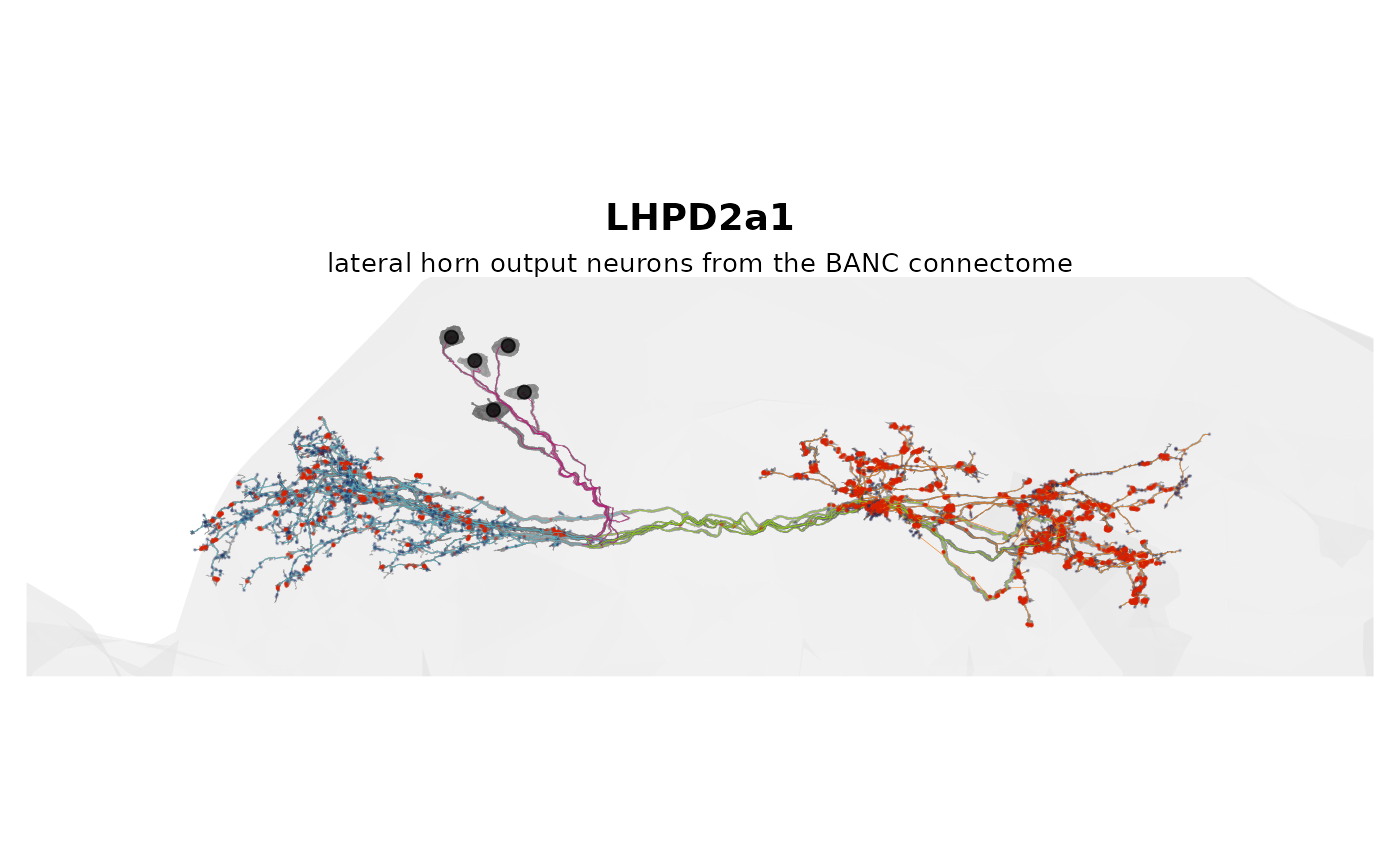
9 — How to make a figure with zoom-to-bounds
Compute a bounding box in the rotated plane; zoom with
ggplot2::coord_fixed().
mesh_bounds <- do.call(rbind, lapply(banc.meshes, function(mesh) {
  vertices <- t(mesh$vb[-4, ])
  if (!is.null(banc_view)) {
    vertices <- t(banc_view[1:3, 1:3] %*% t(vertices))
  }
  data.frame(X = vertices[, 1], Y = vertices[, 2])
}))

x_range <- range(mesh_bounds$X)
y_range <- range(mesh_bounds$Y)
x_padding <- diff(x_range) * 0.1
y_padding <- diff(y_range) * 0.1

nat.ggplot::gganat +
  nat.ggplot::geom_neuron(
    banc.brain_neuropil,
    rotation_matrix = banc_view,
    cols = c("grey95", "grey85"),
    alpha = 0.3
  ) +
  nat.ggplot::geom_neuron(
    banc.meshes,
    rotation_matrix = banc_view,
    cols = c("grey60", "grey40"),
    alpha = 0.8
  ) +
  nat.ggplot::geom_neuron(
    banc.neurons.flow,
    threshold = 15000,
    root = 2,
    size = 0.1,
    rotation_matrix = banc_view
  ) +
  ggplot2::coord_fixed(
    xlim = c(x_range[1] - x_padding, x_range[2] + x_padding),
    ylim = c(y_range[1] - y_padding, y_range[2] + y_padding)
  ) +
  ggplot2::theme(
    plot.background = ggplot2::element_rect(fill = "white", color = NA),
    plot.title = ggplot2::element_text(hjust = 0.5, size = 14, face = "bold"),
    plot.subtitle = ggplot2::element_text(hjust = 0.5, size = 10),
    plot.margin = ggplot2::margin(10, 10, 10, 10)
  ) +
  ggplot2::labs(
    title = "LHPD2a1",
    subtitle = "lateral horn output neurons from the BANC connectome"
  )
#> Warning in nat::stitch_neurons_mst(dendrites, threshold = threshold): Could not
#> connect two vertices as edge length40570.11 is above threshold
#> Warning in nat::stitch_neurons_mst(dendrites, threshold = threshold): Could not
#> connect two vertices as edge length48970.73 is above threshold
#> Warning in nat::stitch_neurons_mst(dendrites, threshold = threshold): Could not
#> connect two vertices as edge length52407.35 is above threshold
#> Warning in nat::stitch_neurons_mst(dendrites, threshold = threshold): Could not
#> connect two vertices as edge length49254.28 is above threshold
#> Warning in nat::stitch_neurons_mst(axon, threshold = threshold): Could not
#> connect two vertices as edge length19129.53 is above threshold
#> Warning in nat::stitch_neurons_mst(dendrites, threshold = threshold): Could not
#> connect two vertices as edge length27245.48 is above threshold
#> Warning in nat::stitch_neurons_mst(dendrites, threshold = threshold): Could not
#> connect two vertices as edge length25094.17 is above threshold
#> Coordinate system already present.
#> ℹ Adding new coordinate system, which will replace the existing one.