The goal of neuronbridger is to provide R client utilities for interacting with the NeuronBridge neuron matching service. This can help a user design sparse genetic driver lines for D. melanogaster neurons (i.e. split-GAL4 lines) and discover what connectome-derived neuronal cell types are targetted by which extant genetic driver lines. This is becoming increasingly important as wet-lab biologists attempt to make sense of connectomic data (Bates et al. 2019).
The NeuronBridge website provides and interface for loading and examining neuron matching results for D. melanogaster brains. Specifically, its aim is to enable one to search light (LM) and electron microscopy (EM) data sets of the D. melanogaster nervous system provided by the FlyLight and FlyEM projects at Janelia Research Campus.
You can find similar neurons based on shape regardless of data set. The NeuronBridge tool was built by FlyLight and scientific computing at Janelia Research Campus, see acknowledgements.
Using this R package in concert with the natverse ecosystem is recommended. For example, the package vfbr grants R side client utilities for virtualflybrain.org, allowing users to pull registered, fly brain confocal stacks for GAL4 lines. The package hemibrainr contains more specific tools for annotations and analysis of the hemibrain connectome.
Data sets
The major EM dataset at the time when this package was built was the hemibrain connectome. Connectome data can be seen using the neurPrint website and accessed programmatically in R using neuprintr.
Users of NeuronBridge can discover which Genaration 1 GAL4 lines and split-GAL4 lines contain which hemibrain connectome neurons. GAL4 lines are genetic driver lines that can be used to express transgenes (e.g. flourescent proteins) in relatively small numbers of neurons in live flies. Linking them to results from the connectome enables researchers to experimentally manipulate components of the fly brain’s ‘wiring diagram’.
How have these searches been performed?
NeuronBridge uses results from a ‘colour depth mask search’. The methodology has recently been published (Otsuna et al. 2018). This method represents 3d voxel space in a 2d image by encoding depth as colour, and allows for a fast pixel-based comparison across specimens. Both LM image volumes and EM reconstructions can be represented in this space, leading to efficient LM->EM and EM->LM searching.
Images are represented as colour ‘maximum intensity projection images’ (MIPs). A MIP is there not a ‘stack’ of images, but a single pane.
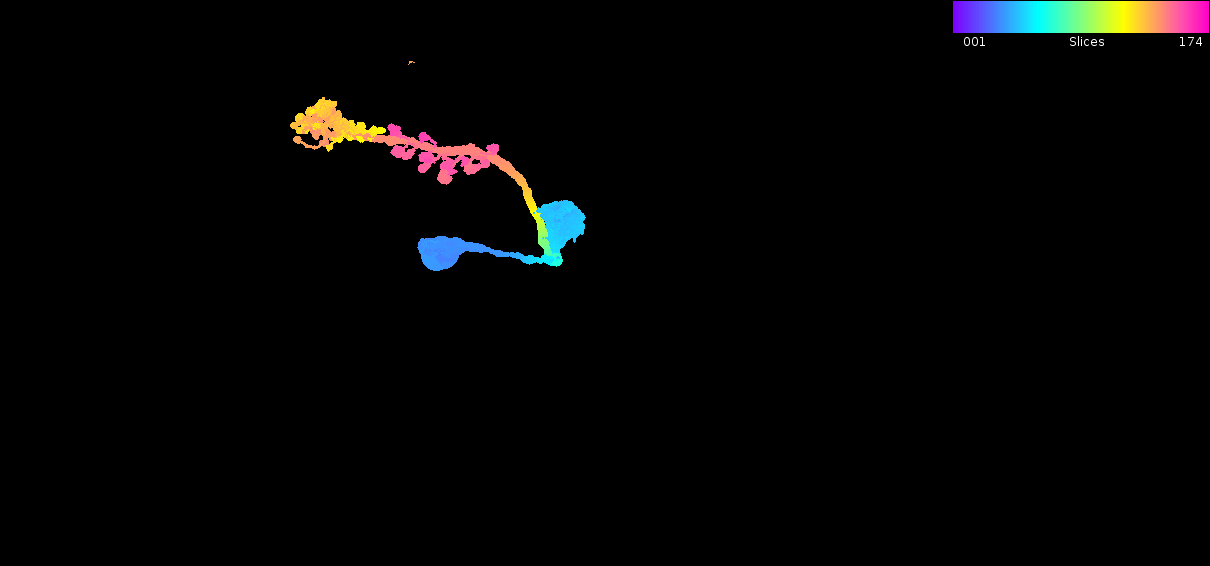
Here is an example of a MIP for a hemibrain neuron (542634818, the DM1 olfactory uPN):
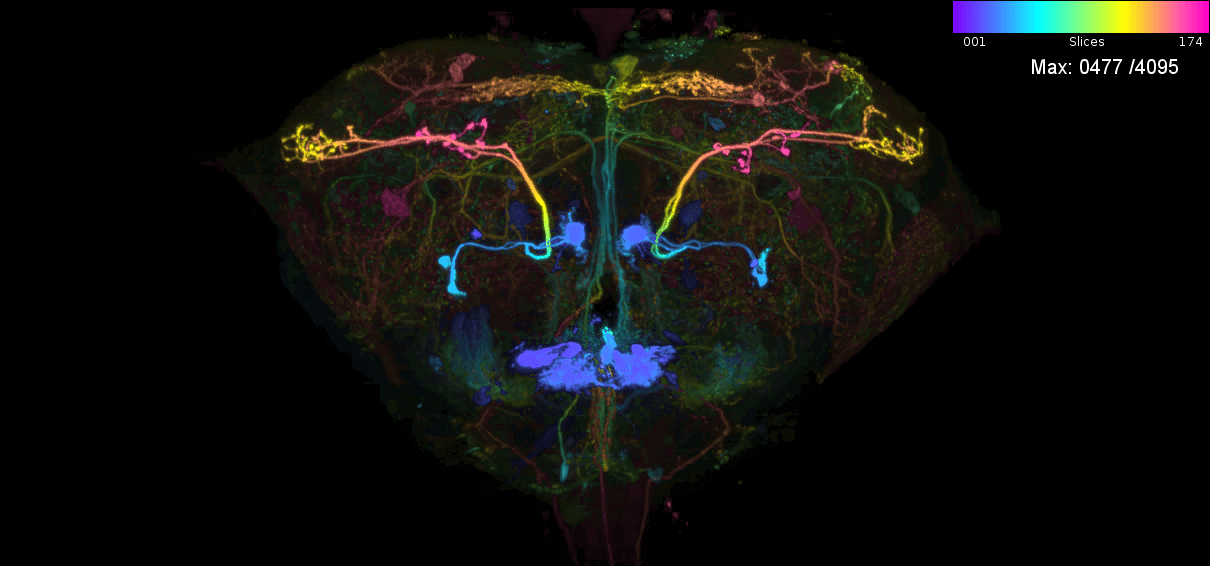
And for a GAL4 lines that seems to contains that neuron (R84D10, data from stochastic labelling (MCFO) of line (Meissener et al. 2020)):
NeuronBridge loads precomputed matches between FlyLight Split GAL4 and MCFO vs Hemibrain 1.1. See its release notes and data version release notes.
The data is also available on quilt.
NBLAST can also be used to match EM and LM neurons. However, it works best with ‘skeletonised’ neurons. Using ‘colour depth mask search’ circumvents this ‘skeletonisation’ step for both volumetric EM data and LM data. This step is still non-trivial. We have used NBLAST to match skeletons between two EM dataset, see: neuron matching with hemibrainr.
Why would I need to look at these results in R?
The NeuronBridge website is great for examining results. However, if we want to consider many neurons are once it is easiest to do so in an environment like R. A common goal these days is to use tools such as NeuronBridge to design ‘split-GAL4’ lines to sparsely target neurons of experimental interest to an investigator, ideally an individual cell type. A cell type may contain as little as 1-5 neurons on average (Bates et al. 2019).
With neuronbridger one thing we can try to do is search for lines that are a hit for many neurons we want (e.g. all members of a cell type from the hemibrain connectome). Another, is to try to avoid lines that seem to contain neurons we do not want (e.g. similar looking hemibrain neurons, or common line contaminant you do not want, for some experimental reason). This could be critical for some experiments. Ultimately clean lines enable one to see neurons better during, for example, calcium imaging, or allow experimenters to only manipulate those cells when performing, for example, optogenetic behavioural experiments.
Tutorial
Let us to grips with neuronbridger.
Installation
# install
if (!require("remotes")) install.packages("remotes")
remotes::install_github("natverse/neuronbridger")

# use
library(neuronbridger)
Example
Now we can have a look at what is available. Let us be interested in the hemibrain neuron 542634818, the DM1 uPN. This neuron is an olfactory projection neurons from the antennal lobe glomerulus ‘DM1’ and sends signals into deeper regions of the fly brain in response to odours in the fly’s environment, such as apple cider vinegar and other food-like smells.
Get MIP information for a connectome neuron
# What neurons can be searched using NeuronBridge?
all.nb.ids = neuronbridge_ids()
length(neuronbridge_ids)
## So there is over 36k neurons/lines that can be searched

# I am interested in the hemibrain neuron, 542634818.
## Do we have it?
id = "542634818"
id%in%all.nb.ids
## Yes!

# What do we have on it?
nb.info = neuronbridge_info(id)
View(nb.info)
## So here you see one entry because only one MIP file matches the given ID
## In some cases, esp. for GAL4 line, there may be multiple entries because multiple images for stochastic labelling have been taken.
## In this data frame, you find interesting fields such as the dataset the ID if from (libraryName), the locations at which NeuronBridge saves
## MIP files related to this neuron, the gender of the fly brain from which this data item came.
## Importantly there is an internal NeuronBridge ID for this data item (nb.id, 2820604089967050763).
## Every MIP has its own nb.id because multiple MIPs could relate to the same GAL4 line.
## see ?neuronbridge_info

# Let us now see the related MIP file
dm1.mip = neuronbridge_mip(id)
## This gets every MIP file associated with id

# Plot the MIP image in an rgl viewer
plot_mip(dm1.mip)
Searching for ‘hits’ among genetic driver lines
Now that we know that our hemibrain connectome neuron, the DM1 uPN (542634818), is in the NeuronBridge database, and we have seen its colour MIP, we may want to know what its matches are. Let us go for it:
# In order to look for hits, we need the nb.id not the id
## Why? Well in this case it is moot, but for some data items, i..e GAL4 liens rather than hemibrain neurons, there are multiple MIP files
## Each one may be from a different MCFO experiment, i.e. a different random subset of neurons contained in the full line.
## The id would specify all of these files. The nb.id specifies just the one with which you wish to search.
nb.id = nb.info$nb.id
length(nb.id)
# We just have one

# Find information on hits
nb.hits = neuronbridge_hits(nb.id=nb.id)
## This data frame is already ranked so that the top hits are at the top.

# We can see the top 10 hits
View(nb.hits[1:10,])
## Looks like the Gen1 GMR GAL4 lines R84D10 and R26B04 target the DM1 uPN.
## We could design a split-GAL4 lien using hemidrivers from these lines.
## Though they are likely to also give us similar looking PNs that are not
## the DM1 uPN, in addition to the DM1 uPN ....

# We can take a quick look at the score distribution
hist(nb.hits$normalizedScore)
## As expected, most lines are not going to contain our neuron!

# Let us scan through our top 10 hits and see what they look like
scan_mip(mips = nb.hits, no.hits = 10)

# Good, some nice looking possibilities there.
## We have saved a lot of MIP files in our local directory.
## Which is good if we wish to keep accessing them, but we can clear with:
neuronbridge_remove_mips()

# This said, best practice would be to set the option 'neuronbridger' to a location
## on your computer, where MIP files cna be downloaded and view at your leisure. I.e.
# options(neuronbridger="PATH/TO/MY/MIPS")
Filtering for the best hits
However, there are a lot of neurons that look like the DM1 uPNs. In fact, we can see a load of them like this:
if (!require("hemibrainr")) remotes::install_github("flyconnectome/hemibrainr")

# Load package to examine hemibrain data
library(neuprintr)

# Get all olfactory PNs
all.pns = neuprintr::neuprint_read_neurons(hemibrainr::pn.ids)
## There's a lot of neurons to grab, it might take a while

# Now plot!
nat::nopen3d()
hemibrainr::hemibrain_view()
plot3d(all.pns[id], col = "black", lwd = 5, soma = 1000) # in black, the DM1 uPN
plot3d(all.pns, soma = 500, lwd = 0.5, alpha = 0.25)

# See the problem?
## These are all different neurons, and many different neuron types. There is only oneDM1 uPN.
## However, there is a lot that looks similar that might also be labelled by the same lines.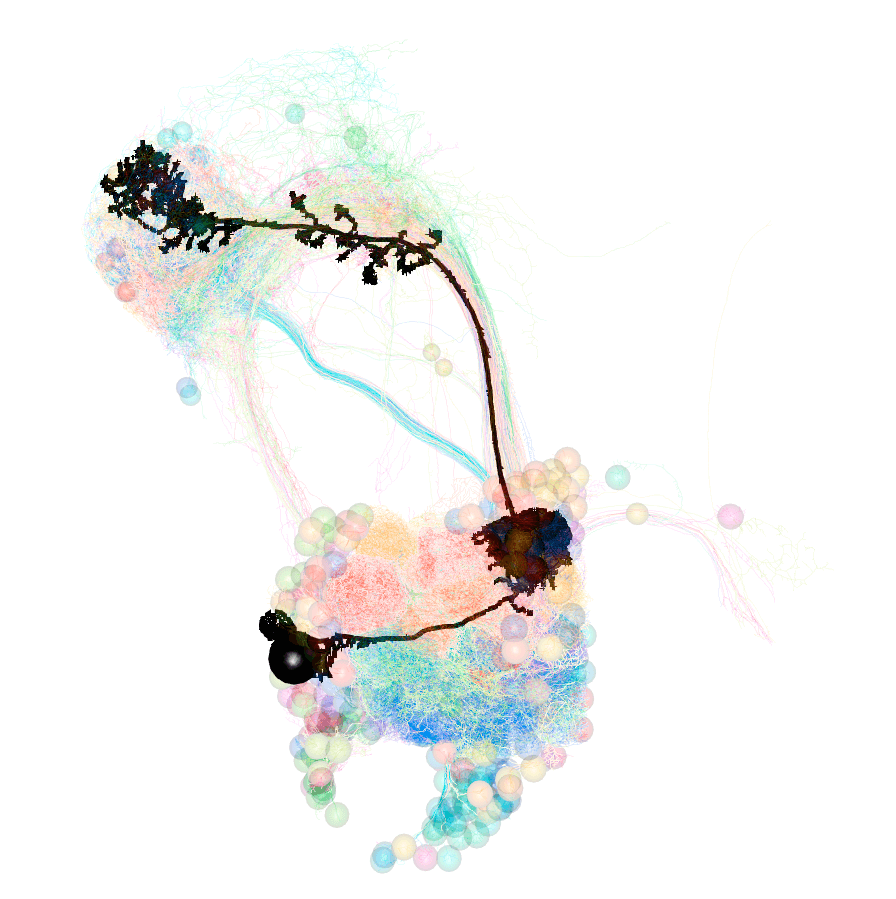
So how can we make sure we only get the PN we want, and not these other PNs?
# So this is the one we want
search = "542634818"

# And we do not want these other PNs
avoid = setdiff(hemibrainr::pn.ids,search)

# Search! ASnd get info on those neurons we do not like as well.
nb.a = neuronbridge_avoid(search = search, avoid = avoid)
## This may take a long time as 'avoid' has many IDs
### Luckily, we have a loading bar!

# Examine the results
View(nb.a)
## A lot of our top hits have neurons we would rather not have huh
Which connectome neurons are inside each genetic driver line?
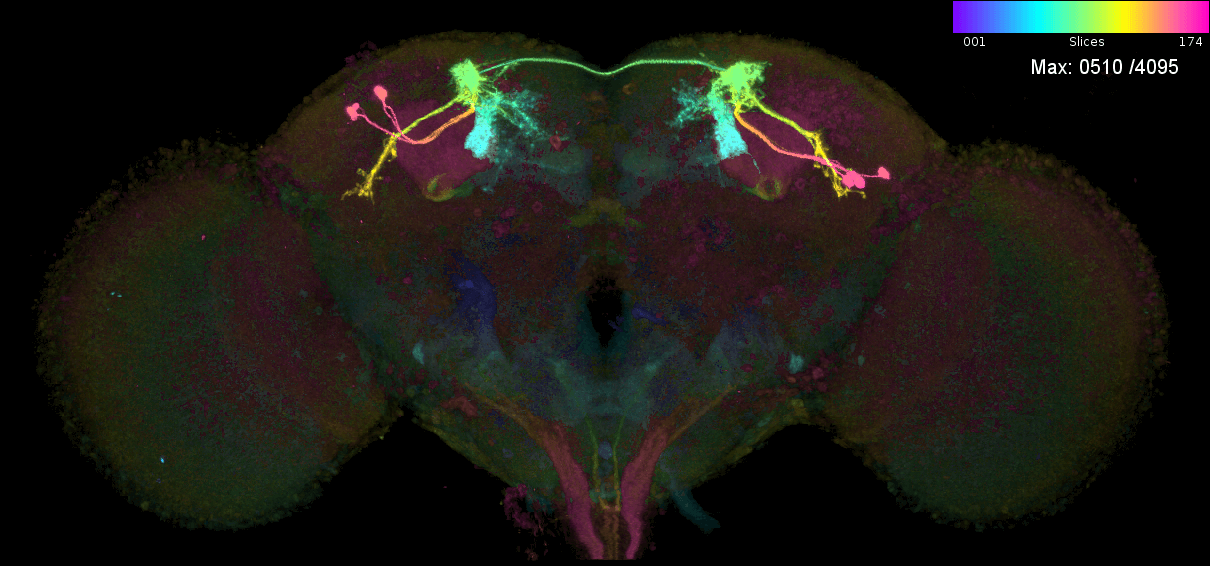
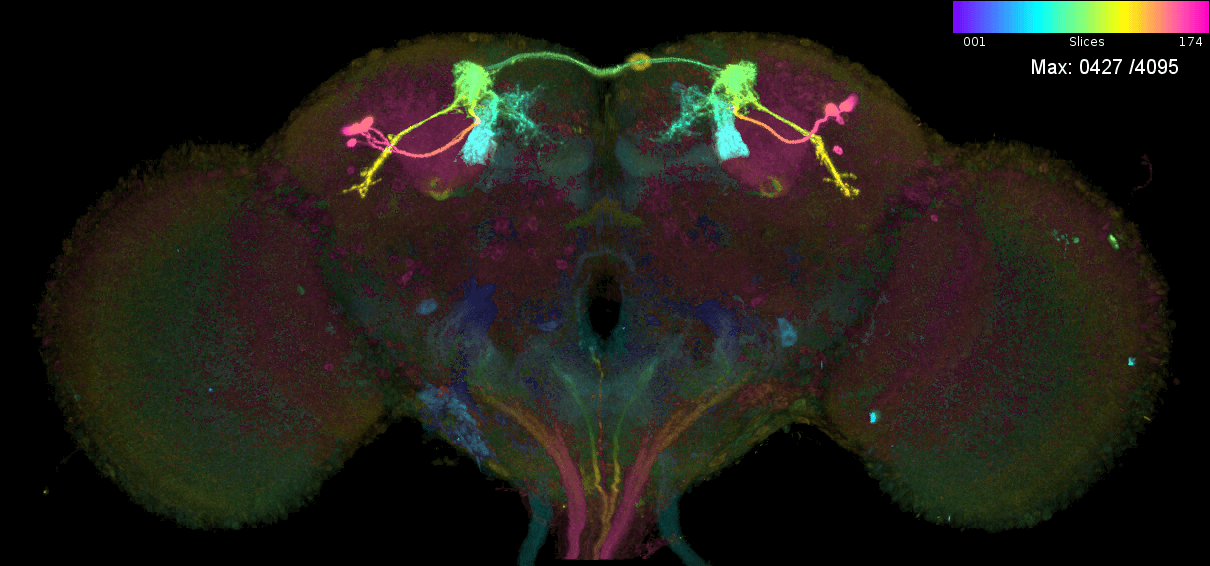
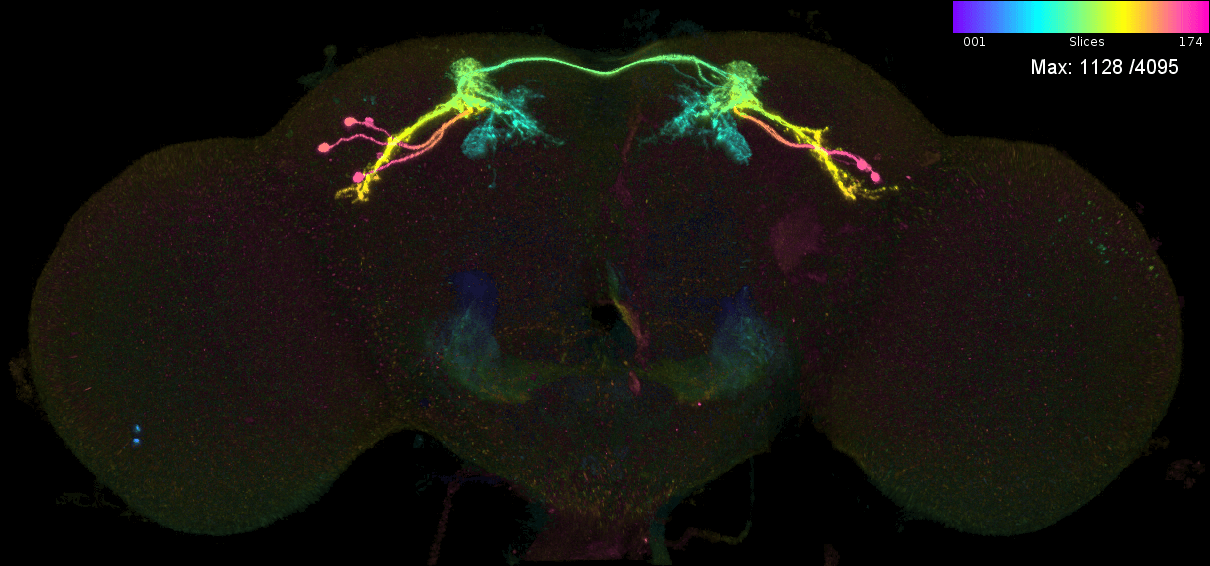
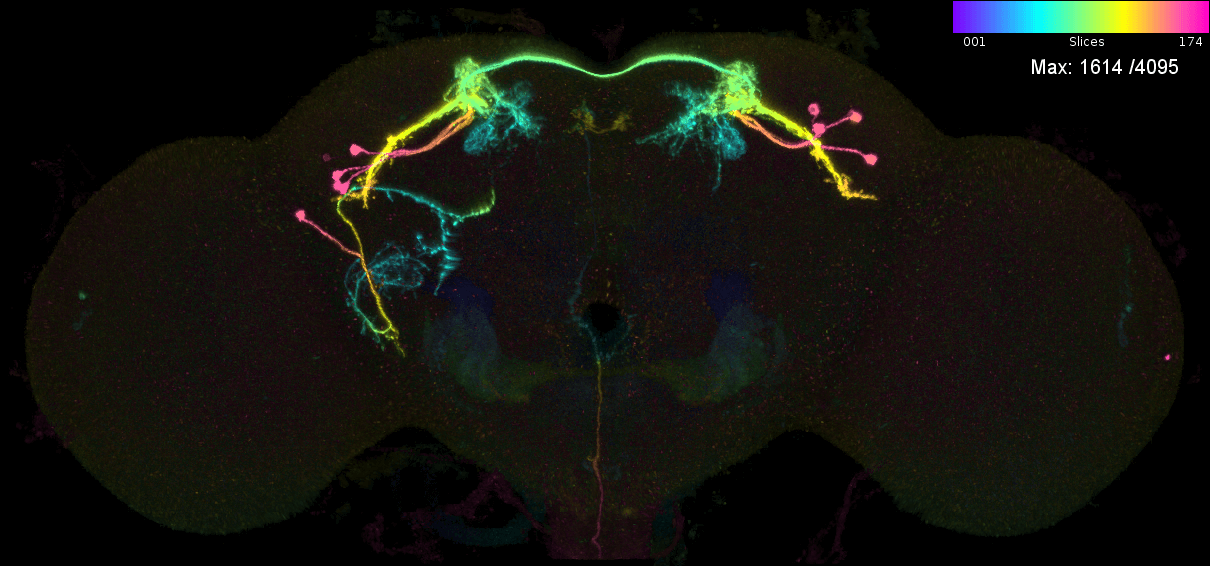
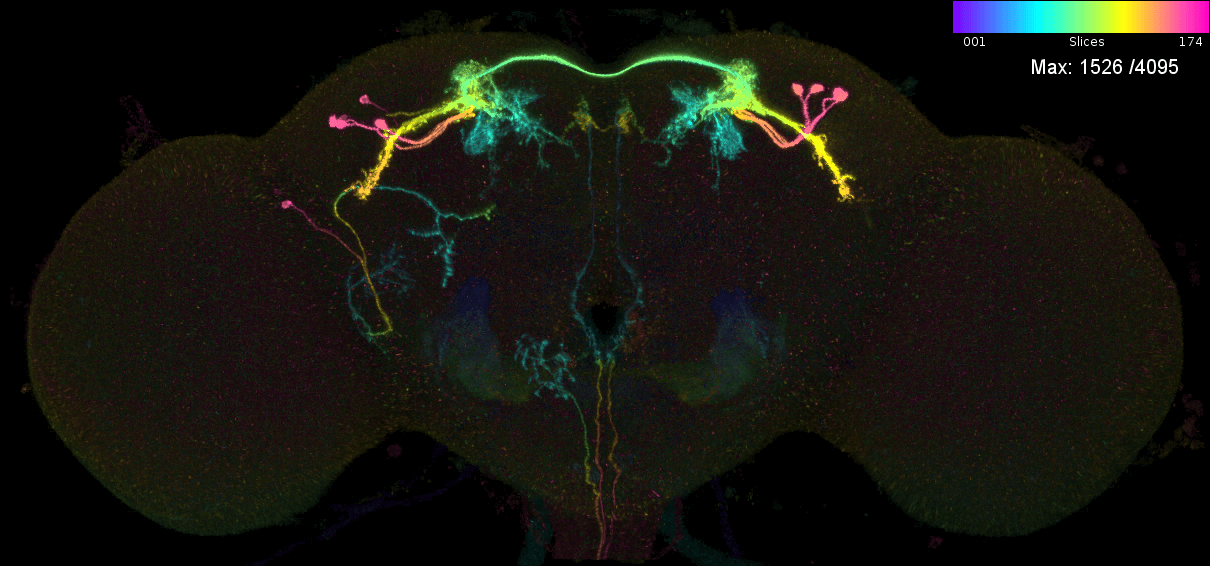
We may also want to predict which neurons are in a given genetic driver line. Let us consider the case of MB543B, a generation 1 GMR line that is pretty ‘sparse’ and seems to label neurons from the mushroom body (Aso et al., 2014). There are 5 ‘MCFO’ images for this neuron. This means that the FlyLight team has stochastically labelled a subset of neurons in this line five times (Meissener et al. 2020). Each time they took a confocal stack, which was later converted into a colour MIP. We can examine the ‘MIP search matches’ for each of these images to try to determine the ‘contents’ of this line i.e. which neurons from the hemibrain connectome it might target.
These are the individual MIPs for different MCFO experiments for the GAL4 line MB543B:
Let us see which connectome neurons have high matching scores:
# Interesting line that labels mushroom body neurons
## But which ones?
line = "MB543B"

# Let's find out
contents = neuronbridge_line_contents(line = line, threshold = 23000)
## Note! Choosing the right threshold for the nomarlsied MIP-comparison score
### Is critical. This may take some titring for lines you are really interested in
#### Though this value is a good first pass.

# So this is what is likely in this line!
## Note we have meta-data from neuprint! So we can see neuron types and names!!
View(contents)

# Now let's check what these neurons look like
if (!require("neuprintr")) remotes::install_github("natverse/neuprintr")

# Load package
library(neuprintr)
## Note you need to 'login' to neuPrint through R
### Look at the package README and/or examine: ?neuprint_login

# Let's see the EM neurons all together
cont.neurons = neuprintr::neuprint_read_neurons(unique(contents$publishedName))

# Plot in 3d!
hemibrainr::hemibrain_view()
plot3d(cont.neurons, lwd  = 2, soma = 500)
plot3d(hemibrainr::hemibrain.surf, col = "grey", alpha = 0.1)

# And compare with the LM data:
open3d()
mips = neuronbridge_mip(line)
scan_mip(mips,type="images", sleep = 5)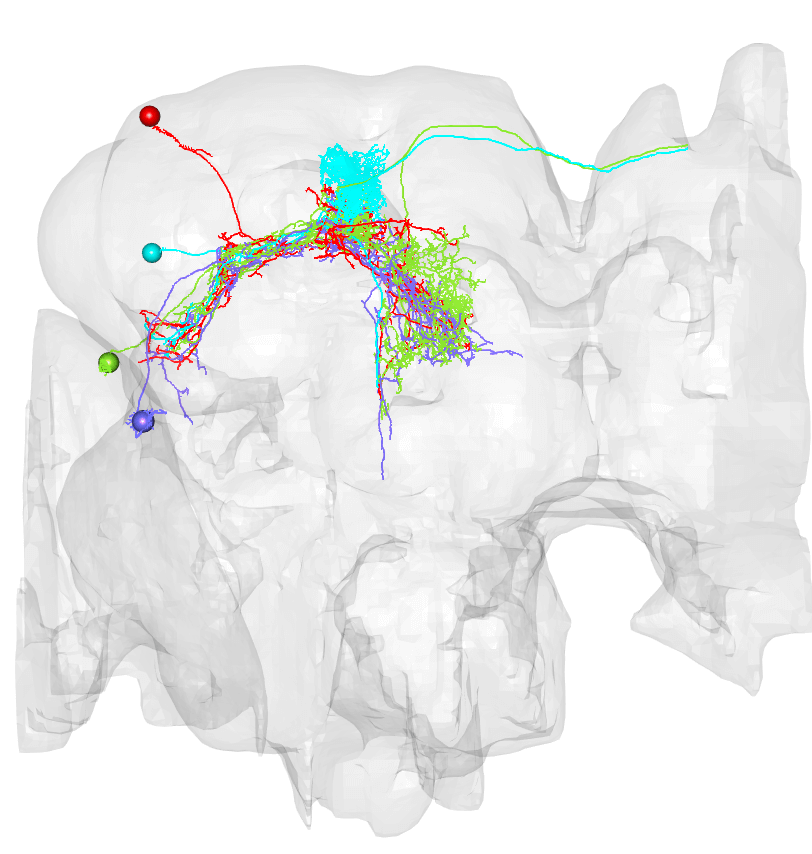
We can use this to try to work out how to design a ‘split’ line. The split-GAL4 method allows an experimenter to ‘intersect’ the expression of two GAL4 lines, and in so doing produce a ‘split-GAL4’ line that only targets those neurons in both patterns. Note that some MIPs in the NeuronBridge database already represent split-GAL4 line.
So returning to our DM1 uPN issue, let’s see what we might hope to get from combining the GAL4 lines that appear to be our bets hit:
# Based on the results above
line1 = "R84D10" # this line seems to be the top hit for the EM DM1 uPN
line2 = "VT033006" # this is not the secodn highest, but has fewer of the neurons we do not like if we inspect nb.a above.

# What neurons might we expect?
potential.split = neuronbridge_predict_split(line1 = line1, line2 = line2,
                                             threshold1 = 23000, threshold2 = 23000)
message("Potentially ~", nrow(potential.split), " neurons in this predicted split")
View(potential.split)
Conclusions
Bear in mind that this function and some others are very sensitive to the value you give the threshold argument!! You will have to empirically determine a good value for this - it might differ given the kind of neurons you are looking at for example.
Of course - do not go planning any experiments based on the results of this package without looking at the 3D stacks for GAL4 lines first! The results from these functions are only as good as the LM-EM matching scores from the colour MIP searches performed by FlyLight. In addition, the more stochastic labelling (MCFO) that has been performed on a line, the more certain we can be of its contents - but many lines need a lot more MCFO.
Generate your own colour-depth MIPs
Once you have a connectome neuron mesh in NeuronBridge-compatible NeuronBridge template space (JRC2018U_HR for brain neurons, JRC2018VNCU_HR for VNC neurons — both the high-res unisex 20× variants Janelia’s pre-computed ColorMIPs are served at), nrrd_to_mip() produces the same colour-depth MIPs that FIJI’s Color_Depth_MIP_batch_0308_2021.ijm macro produces — but in pure R, no JVM, no interactive folder picker:
# 1) Render the FlyWire / BANC mesh into a JRC2018U_HR-sized .nrrd
root_id_to_nrrd("720575940632295751",
                reference  = "JRC2018U_HR",
                savefolder = "~/asta_sez_mips")

# 2) Colour-depth MIP every NRRD in the folder, in pure R
nrrd_to_mip("~/asta_sez_mips", method = "direct", target_space = "brain")
For real LM stacks where every voxel has some background signal, nrrd_to_mip() defaults to threshold = "auto" (Triangle, the same auto-method Janelia’s FIJI macro picks) plus denoise = "auto" (3 × 3 × 3 median filter, the equivalent of FIJI’s Mask Median Subtraction) so a noisy receptor stain renders as cell bodies + neuropil rather than a rainbow-coloured brain silhouette. Both are skipped automatically for binary inputs, and explicit "otsu", raw cutoff, or quantile thresholds are available.
method = "direct" (default) is pure R; method = "python" calls Stephan Gerhard’s BANC port via reticulate for byte-level validation; method = "fiji" shells out to the original Janelia macro. Output of all three is indistinguishable in NeuronBridge searches; pure-R vs Python differ by at most 1/255 RGB unit on ≈1% of pixels. Below: the BANC v888 AstA1 bilateral pair (cell_type == "AstA1", root_888 IDs 720575941506055874 and 720575941541909965) rendered through method = "direct" (top), method = "python" (middle), and |R − Python| × 50 amplified (bottom):
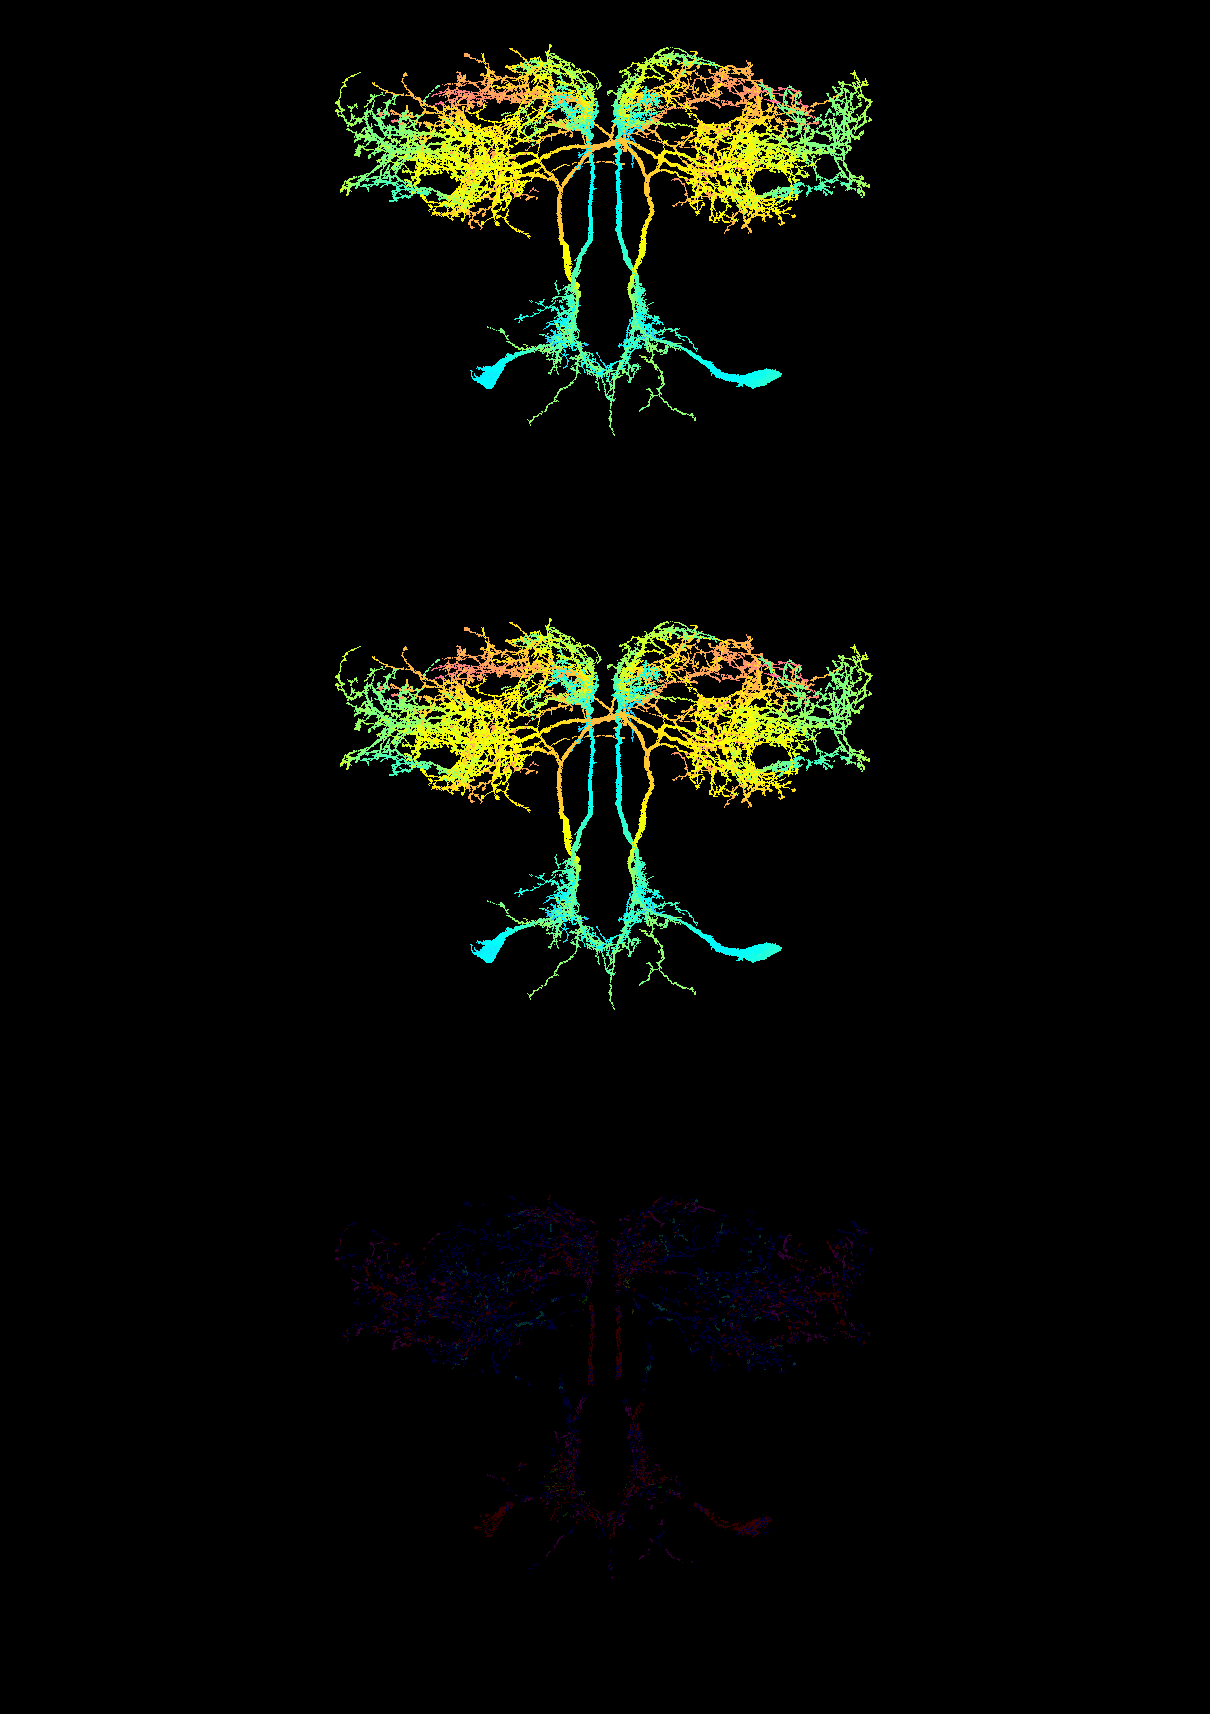
See vignette("colormip_direct_vs_fiji") for the full pipeline (BANC AstA1 mesh → JRC2018U_HR bridging → NRRD → MIP) and the back-end-equivalence proof.
Serve LM image data alongside BANC in Neuroglancer
nrrd_to_precomputed() writes any 3-D image volume (registered LM stacks, atlas templates, masks) as a Neuroglancer precomputed image layer — the same on-disk format that BANC’s public EM, segmentation and JRC2018F_aligned240721_to_BANC.ng atlas layers ship in. The companion BANC-specific bancr::banc_lm_scene() (lives in bancr) then assembles a Spelunker state with the new layer (same short-URL form bancr::bancsee() produces) overlaid on the canonical public BANC scene.
# 1) Convert your registered NRRD to precomputed (cloud-volume via reticulate)
nrrd_to_precomputed(
input = "CapaR_in_BANC.nrrd",
output = "/tmp/CapaR_pc",
resolution = c(380, 380, 380), # nm; JRC2018F-native
data_type = "uint8"
)
# 2) Upload to a public-readable bucket *you control*, then build a
# sharable BANC URL pointing at it:
# gsutil -m cp -r /tmp/CapaR_pc gs://your-bucket/lm/CapaR/
bancr::banc_lm_scene(
"gs://your-bucket/lm/CapaR",
layer_name = "Kondo 2020 — CapaR",
shorten = TRUE, # spelunker short URL via banc_shorturl
open = TRUE
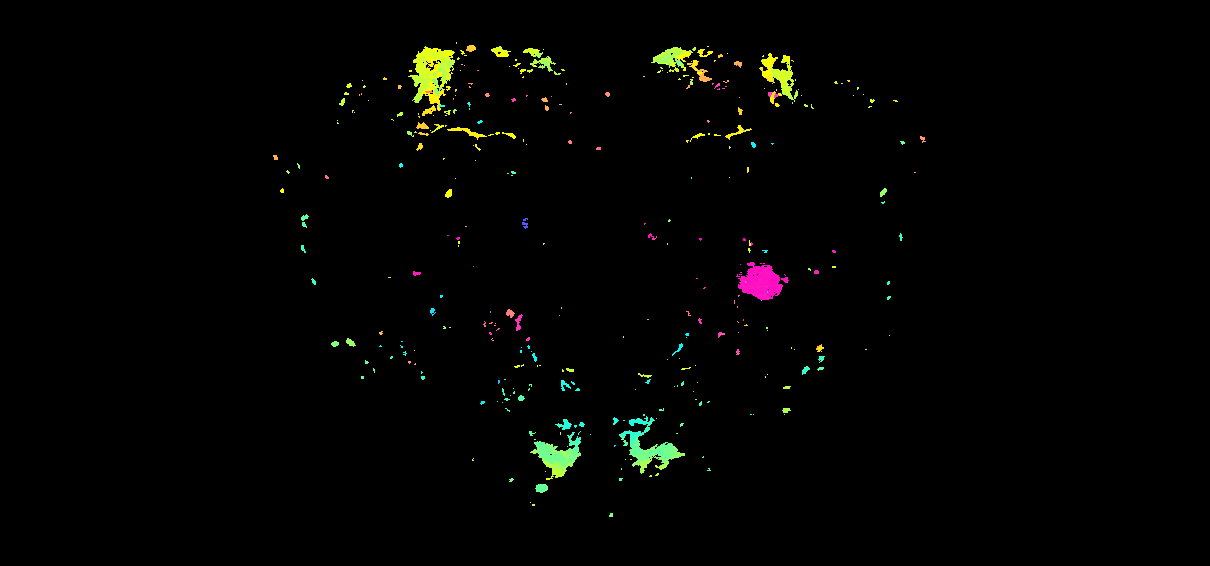
)The Kondo 2020 Capability receptor stain in IS2 template space (left: grayscale max-projection of the source NRRD; right: same data through nrrd_to_mip() for a depth-encoded view):
See vignette("lm_layer_neuroglancer") for the full pipeline (IS2 → JRC2018F → BANC voxel space, precomputed write, scene assembly).
Acknowledgments
Data and tools
NeuronBridge was developed by scientific advisors (Geoffrey Meissner, Wyatt Korff, Gudrun Ihrke), data scientists (Hideo Otsuna) and software developers (Jody Clements, Cristian Goina, Rob Svirskas, Konrad Rokicki, Antje Kazimiers) at Janelia Research Campus.
Please examine the NeuronBridge usage terms. If you use results from this package, you should cite this package, Clements et al. 2020 for the NeuronBridge codebase, Ostsuna et al. 2018 for the methodology, and the relevant publications for any data sets used. See below.
This package was created by Alexander Shakeel Bates while in the group of Rachel Wilson. Note the package version mirrors the version of NeuronBridge data it was made to work with. You can cite this package as:
citation(package = "neuronbridger")Bates AS (2020). neuronbridger: R client utilities for interacting with the neuronbridge matching service. R package version 2.1.1. https://github.com/natverse/neuronbridger
Citations
The hemibrain connectome (hemibrain:v1.1): Scheffer, L.K., Xu, C.S., Januszewski, M., Lu, Z., Takemura, S.-Y., Hayworth, K.J., Huang, G.B., Shinomiya, K., Maitlin-Shepard, J., Berg, S., et al. (2020). A connectome and analysis of the adult Drosophila central brain. Elife 9. doi: https://doi.org/10.1101/2020.05.29.080473
Gen 1 GAL4 line MCFO: Meissner, G.W., Dorman, Z., Nern, A., Forster, K., Gibney, T., Jeter, J., Johnson, L., He, Y., Lee, K., Melton, B., et al. (2020). An image resource of subdivided Drosophila GAL4-driver expression patterns for neuron-level searches. bioRxiv. doi: https://doi.org/10.1101/2020.05.29.080473
Gen 1 VT GAL4 lines and hemidrivers: Tirian, L., and Dickson, B. (2017). The VT GAL4, LexA, and split-GAL4 driver line collections for targeted expression in the Drosophila nervous system. bioRxiv. doi: https://doi.org/10.1101/198648
Gen 1 GMR GAL4 lines: Jenett, A., Rubin, G.M., Ngo, T.-T.B., Shepherd, D., Murphy, C., Dionne, H., Pfeiffer, B.D., Cavallaro, A., Hall, D., Jeter, J., et al. (2012). A GAL4-Driver Line Resource for Drosophila Neurobiology. Cell Rep. 2, 991–1001. doi: https://doi.org/10.1016/j.celrep.2012.09.011
GMR hemidrivers: Dionne, H., Hibbard, K.L., Cavallaro, A., Kao, J.-C., and Rubin, G.M. (2018). Genetic Reagents for Making Split-GAL4 Lines in Drosophila. Genetics 209, 31–35. doi :https://doi.org/10.1534/genetics.118.300682
JRC2018F brain and VNS templates: Bogovic, J.A., Otsuna, H., Heinrich, L., Ito, M., Jeter, J., Meissner, G.W., Nern, A., Colonell, J., Malkesman, O., Ito, K., et al. (2018). An unbiased template of the Drosophila brain and ventral nerve cord. bioRxiv. doi: https://doi.org/10.1101/376384
Colour MIP search tool: Otsuna, H., Ito, M., and Kawase, T. (2018). Color depth MIP mask search: a new tool to expedite Split-GAL4 creation. bioRxiv. doi: https://doi.org/10.1101/318006
NeuronBridge codebase: Clements, J., Goina, C., Kazimiers A., Otsuna, H., Svirskas, R., Rokicki K. (2020) NeuronBridge Codebase. software
Janelia split-GAL4 lines: various
What is a fly brain cell type: Bates, A.S., Janssens, J., Jefferis, G.S., and Aerts, S. (2019). Neuronal cell types in the fly: single-cell anatomy meets single-cell genomics. Curr. Opin. Neurobiol. 56, 125–134. doi: https://doi.org/10.1016/j.conb.2018.12.012
