plot.dotprops plots a 2D projection of a
dotprops format object
plot.neuron plots a 2D projection of a neuron
# S3 method for dotprops
plot(
  x,
  scalevecs = 1,
  alpharange = NULL,
  col = "black",
  PlotPoints = FALSE,
  PlotVectors = TRUE,
  UseAlpha = FALSE,
  asp = 1,
  add = FALSE,
  axes = TRUE,
  tck = NA,
  boundingbox = NULL,
  xlim = NULL,
  ylim = NULL,
  soma = FALSE,
  ...
)

# S3 method for neuron
plot(
  x,
  WithLine = TRUE,
  WithNodes = TRUE,
  WithAllPoints = FALSE,
  WithText = FALSE,
  PlotSubTrees = TRUE,
  soma = FALSE,
  PlotAxes = c("XY", "YZ", "XZ", "ZY"),
  axes = TRUE,
  asp = 1,
  main = x$NeuronName,
  sub = NULL,
  xlim = NULL,
  ylim = NULL,
  AxisDirections = c(1, -1, 1),
  add = FALSE,
  col = NULL,
  PointAlpha = 1,
  tck = NA,
  lwd = par("lwd"),
  boundingbox = NULL,
  ...
)
Arguments
- x
a neuron to plot.
- scalevecs
Factor by which to scale unit vectors (numeric, default: 1.0)
- alpharange
Restrict plotting to points with
alphavalues in this range to plot (default: null => all points). Seedotpropsfor definition ofalpha.- col
the color in which to draw the lines between nodes.
- PlotPoints
Whether to plot points and/or tangent vectors (logical, default: tangent vectors only)
- PlotVectors
Whether to plot points and/or tangent vectors (logical, default: tangent vectors only)
- UseAlpha
Whether to scale tangent vector length by the value of
alpha- asp
the
y/xaspect ratio, seeplot.window.- add
Whether the plot should be superimposed on one already present (default:
FALSE).- axes
whether axes should be drawn.
- tck
length of tick mark as fraction of plotting region (negative number is outside graph, positive number is inside, 0 suppresses ticks, 1 creates gridlines).
- boundingbox
A 2 x 3 matrix (ideally of class
boundingbox) that enables the plot axis limits to be set without worrying about axis selection or reversal (see details)- xlim
limits for the horizontal axis (see also boundingbox)
- ylim
limits for the vertical axis (see also boundingbox)
- soma
Whether to plot a circle at neuron's origin representing the soma. Either a logical value or a numeric indicating the radius (default
FALSE). Whensoma=TRUEthe radius is hard coded to 2.- ...
additional arguments passed to plot
- WithLine
whether to plot lines for all segments in neuron.
- WithNodes
whether points should only be drawn for nodes (branch/end points)
- WithAllPoints
whether points should be drawn for all points in neuron.
- WithText
whether to label plotted points with their id.
- PlotSubTrees
Whether to plot all sub trees when the neuron is not fully connected.
- PlotAxes
the axes for the plot.
- main
the title for the plot
- sub
sub title for the plot
- AxisDirections
the directions for the axes. By default, R uses the bottom-left for the origin, whilst most graphics software uses the top-left. The default value of
c(1, -1, 1)makes the produced plot consistent with the latter.- PointAlpha
the value of alpha to use in plotting the nodes.
- lwd
line width relative to the default (default=1).
Value
list of plotted points (invisibly)
Details
plot.dotprops is limited in that 1) it cannot plot somata
directly (this is handled by plot.neuronlist) and 2) it can
only plot a frontal (XY) view.
plot.neuron sets the axis ranges based on the chosen
PlotAxes and the range of the data in x. It is still possible
to use PlotAxes in combination with a boundingbox, for
example to set the range of a plot of a number of objects.
nat assumes the default axis convention used in biological imaging, where the origin of the y axis is the top rather than the bottom of the plot. This is achieved by reversing the y axis of the 2D plot when the second data axis is the Y axis of the 3D data. Other settings can be achieved by modifying the AxisDirections argument.
See also
Other neuron:
neuron(),
ngraph(),
potential_synapses(),
prune(),
resample(),
rootpoints(),
spine(),
subset.neuron()
Examples
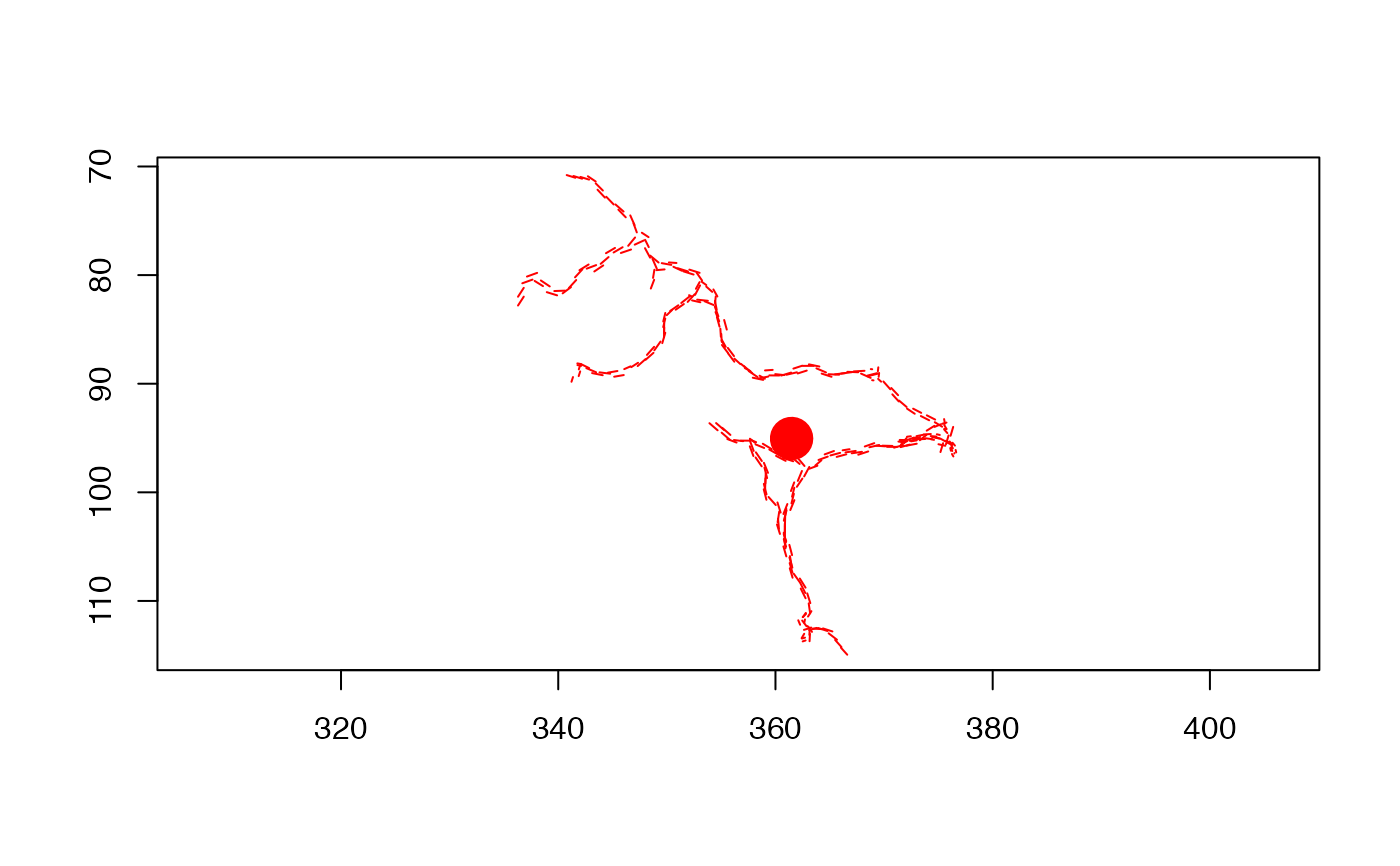
plot(kcs20[[1]], col='red')
# NB soma ignored
plot(kcs20[[1]], col='red', soma=TRUE)
plot(kcs20[1], col='red', soma=TRUE)
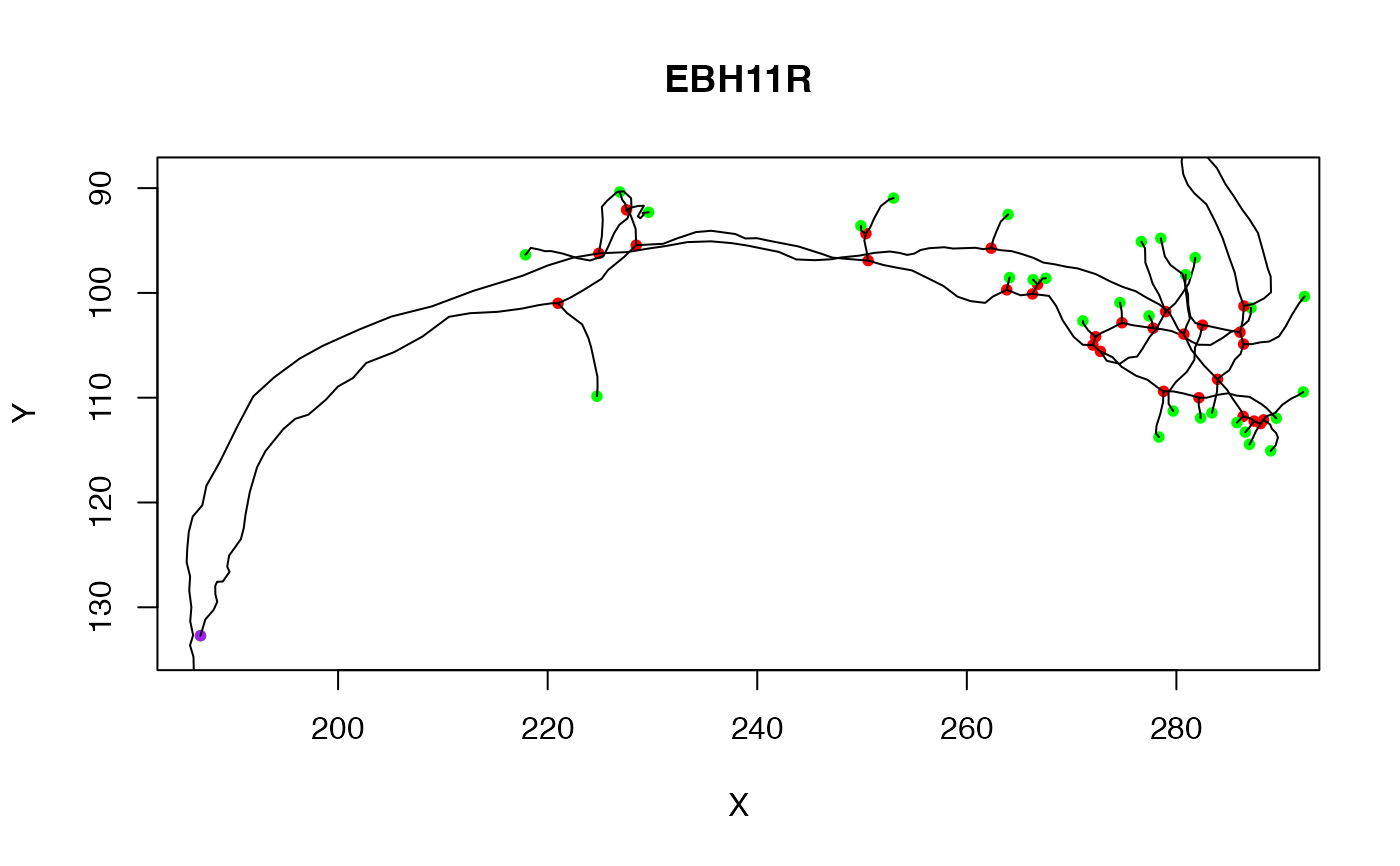
 # Draw first example neuron
plot(Cell07PNs[[1]])
# Overlay second example neuron
plot(Cell07PNs[[2]], add=TRUE)
# Draw first example neuron
plot(Cell07PNs[[1]])
# Overlay second example neuron
plot(Cell07PNs[[2]], add=TRUE)
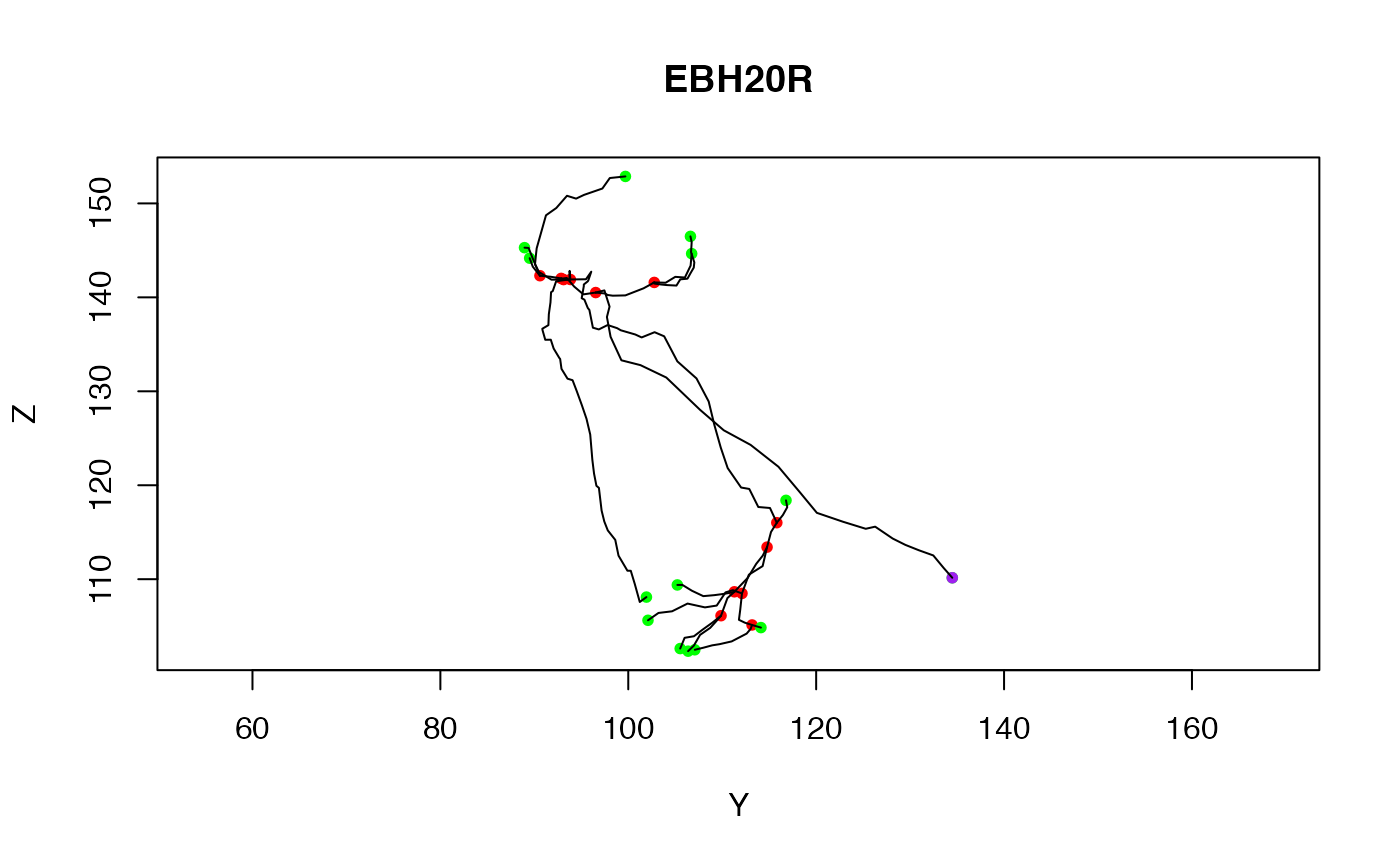
 # Clear the current plot and draw the third neuron from a different view
plot(Cell07PNs[[3]], PlotAxes="YZ")
# Clear the current plot and draw the third neuron from a different view
plot(Cell07PNs[[3]], PlotAxes="YZ")
 # Just plot the end points for the fourth example neuron
plot(Cell07PNs[[4]], WithNodes=FALSE)
# Plot with soma (of default radius)
plot(Cell07PNs[[4]], WithNodes=FALSE, soma=TRUE)
# Just plot the end points for the fourth example neuron
plot(Cell07PNs[[4]], WithNodes=FALSE)
# Plot with soma (of default radius)
plot(Cell07PNs[[4]], WithNodes=FALSE, soma=TRUE)
 # Plot with soma of defined radius
plot(Cell07PNs[[4]], WithNodes=FALSE, soma=1.25)
# Plot with soma of defined radius
plot(Cell07PNs[[4]], WithNodes=FALSE, soma=1.25)
