Introduction
Comparing rgl and plotly
nat provides support for two different 3D graphics systems provided by the CRAN packages rgl and plotly. These are quite different in style and pedigree and there are pros and cons to the use of each.
rgl is a much longer standing library, largely written in C++ to talk to your graphics card’s OpenGL functionality. In general it is more efficient for displaying large amounts of data (hundreds to thousands of neurons). Its main weak point for interactive plotting is that transparent surfaces (i.e. with alpha < 1) are not efficiently handled especially when there is more than one such surface in a scene. It has support for use in online web documents (via WebGL) but this is more restricted and can result in very large html files. Its web support does have quite a flexible system for interacting with buttons/actions, which could be interesting in some cases (see WebGL vignette)
You can use the Plotly library as an alternative to rgl for 3D display. This is based on the commercially developed but open source plotly.js java script library. It is targeted at the web and particularly useful for interactive html documents. For html output, it seems to me more efficient for medium numbers of neurons (10s-100s) than rgl’s WebGL support. It has also has nice functionality e.g. interactive “brushing” that continuously queries the inferred closest point to the cursor and can display configurable information (including database queries). This can identify e.g. individual neurons or brain region meshes shown in a busy plot. One limitation of plotly is that it does not yet support orthographic representations of 3D plots (but see this PR).
Recommendation
- Use rgl for interactive use unless you need the plotly brushing capability or need to plot multiple overlapping transparent surfaces.
- Use plotly for html (e.g. rmarkdown) output unless you need orthographic plots.
Limitations
- Neither package provides good support for very large numbers of neurons in html output.
- Some rgl plot types are not yet supported in plotly e.g.
wire3d()/shade3d()for surfaces/planes asmesh3d()objects andalphashape3d::ashape3d()objects.
Plotly
Plotly can do a whole range of plots. See https://plotly.com/r/ for examples. The standard approach looks like this:
Plotly + nat
For nat we could add a specialised plot type for neurons etc to use with the plot_ly interface, we have opted to keep things as close as possible to the rgl::plot3d() interface that we have already used.
plotly setup
The only setup that is required in your rmarkdown document is to set the nat.plotengine option to make plotly the default 3d plot engine.
plotly examples
We can plot just one neuron:
plot3d(Cell07PNs[[1]])Or multiple neurons from a neuronlist() object.
You can set the figure size by specifying chunk options like so
{r, fig.width=6, fig.height=4}resulting in:
You can also display meshes and dotprops objects:
rgl setup
To set up a document to use rgl, you need to use the rgl::setupKnitr() function. You would normally do this at the top of your rmarkdown like so:
library(nat)
rgl::setupKnitr()
rgl is the default output for nat, so you do not need to choose it explicitly unless you have previously chosen to use plotly as your default 3D plot engine.
options(nat.plotengine = 'rgl')Additional setup is required for each chunk. You must choose either to output a 2D snapshot of the 3D scene or to produce interactive output. Setting the chunk option rgl=TRUE produces a static PNG snapshot.
plot3d(Cell07PNs)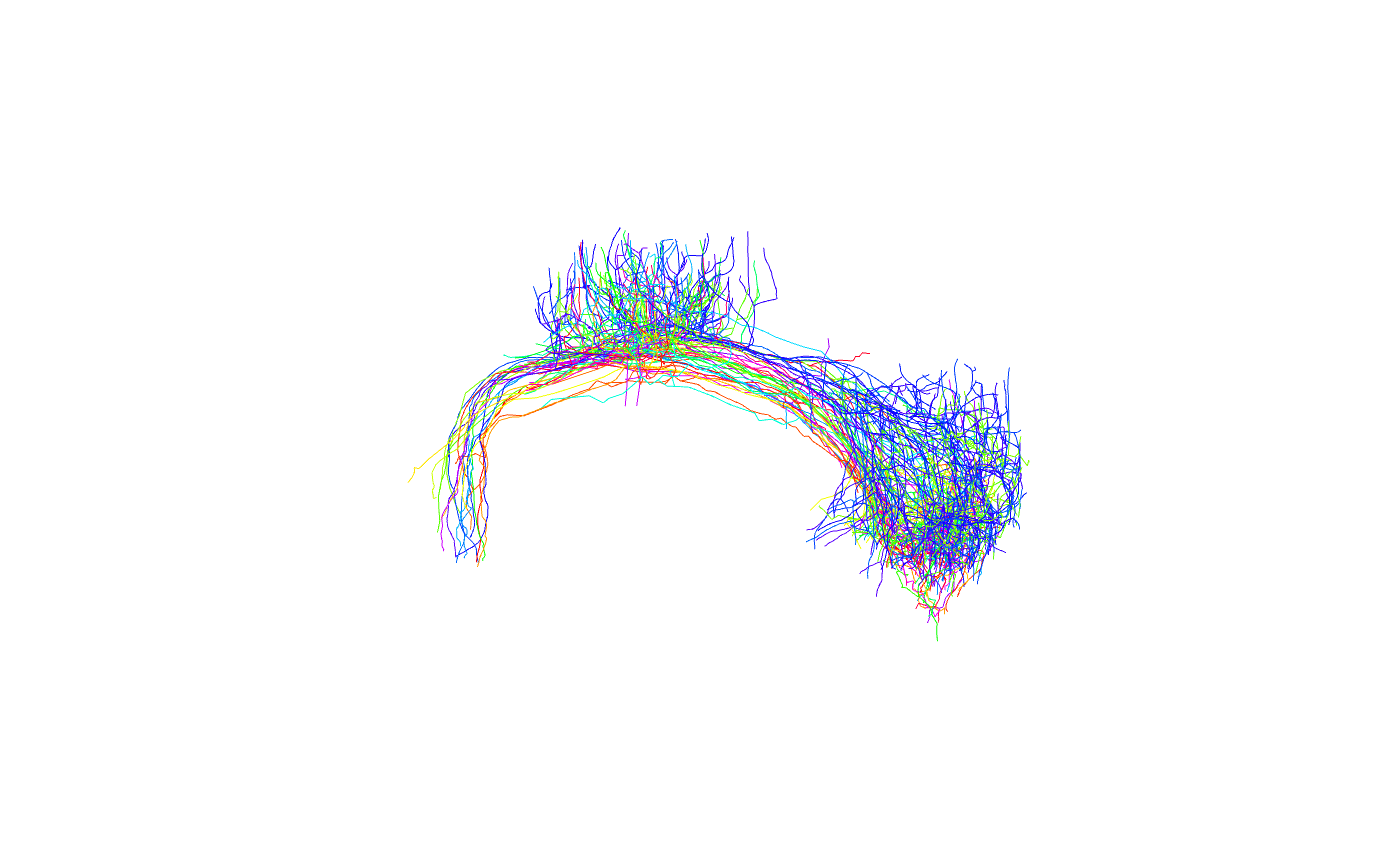
Setting the chunk option webgl=TRUE produces an interactive webGL canvas embedded in your html output document. Note that these can get quite large.
plot3d(Cell07PNs[1:3])Inspect the .Rmd source code of this vignette to see how these options are set.