Connection data
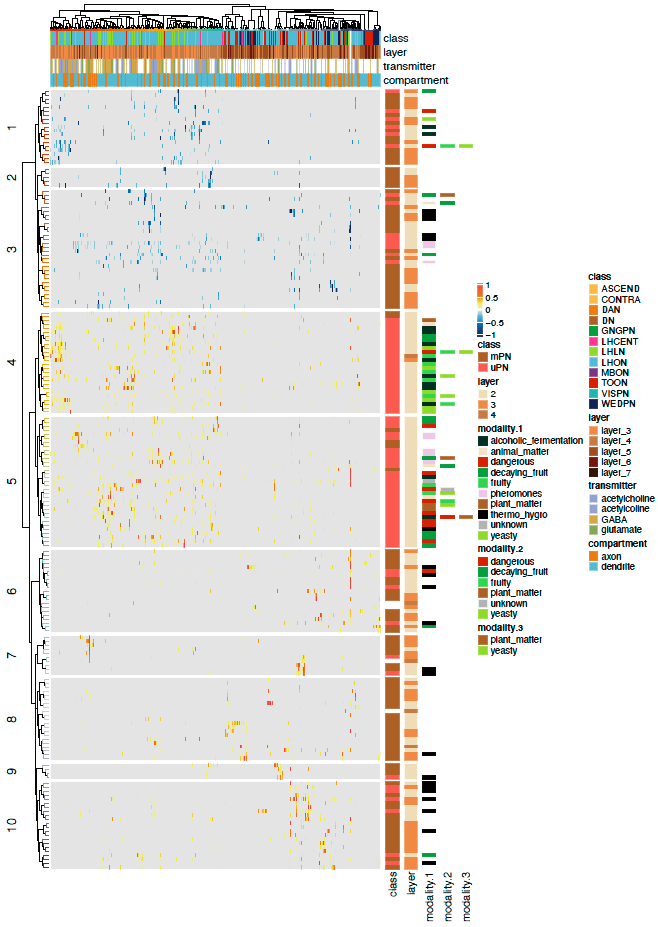
In this guide, we will use examine the connectivity between antennal lobe projection neurons (ALPNs), the principal chemosensory second-order neurons of the fly brain, and their third order targets (TONs). We want to see whether certain groups of ALPNs preferentially connect with certain groups of TONs.
Load google drive
Let’s get hemibrainr and our Google drive loaded:
# Load package
library(hemibrainr)
library(ggplot2)
library(gplots)
library(dplyr)
library(plyr)
library(reshape2)
library(ComplexHeatmap)
library(LaCroixColoR)

# Else, it wants to see it on the mounted team drive, here
options("remote_connectome_data")

# If this does not give a path to the hemibrainr google drive...
## But you do have access, and have set up rclone
### Try:
##### hemibrainr_rclone()
Find neurons of interest
First, let us find these neurons, so we can plot them if we like:
db = hemibrain_neurons()
alpns.nl= db[names(db)%in%pn.info$bodyid]
ton.nl = db[names(db)%in%ton.info$bodyid]
We can now plot them if we like:
# Get ROIs
lhr = neuprint_ROI_mesh("LH(R)")
alr = neuprint_ROI_mesh("AL(R)")

# Plot
nat::nopen3d()
hemibrain_view()
plot3d(lhr, alpha = 0.3, col = hemibrain_bright_colors["green"], add = TRUE)
plot3d(alr, alpha = 0.3, col = hemibrain_bright_colors["red"], add = TRUE)
plot3d(hemibrain.surf, alpha = 0.1, col = "lightgrey", add = TRUE)
plot3d_split(alpns.nl, lwd =2, soma = 600, col = hemibrain_bright_colours["cerise"])
ton.sample = sample(1:length(ton.nl),10)
plot3d_split(ton.nl[ton.sample], lwd =2, soma = 600, col = hemibrain_bright_colour_ramp(length(ton.sample)))
Get neuron connectivity data
Now we can get a precomputed edgelist for the brain from the Google drive, which breaks down connections by axon and dendrite. By default this is read from an SQLite database on the Google drive. This means we can access the data, without loading a multi Gb .csv into memory:
# Get  the edgelist
elist = hemibrain_elist()
meta = rbind.fill(ton.info, pn.info)
In our elist, count is the number of synaptic connections between two arbours. The arbour types are given by Label and partner.Label. The neuron identities are given as pre, the upstream (source) neuron and post, the downstream (target) neuron. The value of norm is generated by taking count and dividing it by the total number of postsynapses on the downstream target’s given arbour (note, not all connection in the neuron!). See your article on neuron splitting, for more information.
alpn.lhn.elist <- elist %>%
  filter(pre %in% local(pn.info$bodyid)
                & post %in% local(ton.info$bodyid)
                & pre.Label == "axon"
                & post.Label %in% c("dendrite","axon")
                & (count > 10 | norm > 0.01)) %>%
  collect() # this is now a data frame. This may take a while to load into R.

# Add some cell_type information
alpn.lhn.elist <- alpn.lhn.elist %>%
  mutate(pre.cell_type = meta[match(pre,meta$bodyid),"cell_type"]) %>%
  mutate(post.cell_type = meta[match(post,meta$bodyid),"cell_type"]) %>%
  filter(pre.cell_type != "NA") %>%
  filter(post.cell_type != "NA") %>%
  as.data.frame(stringsAsFactors=FALSE)

# Convert edgelist to a connectivity matrix
conn.mat = acast(data = alpn.lhn.elist,
                 formula = pre.cell_type ~ post.cell_type + post.Label,
                 fun.aggregate = mean,
                 value.var = "norm",
                 fill = 0)

# Negative weights for inhibitory connections
inhib.pns = unique(subset(pn.info, neurotransmitter %in% c("GABA","glutamate"))$cell_type)
conn.mat[inhib.pns,] = -conn.mat[inhib.pns,]

# Max normalisation
normalise <- function(x){
    return(x/max(abs(x)))
}
conn.mat.scaled = t(apply(conn.mat,1,normalise))
Now we can plot a heatmaps of the ALPN->TON weights, and correlation heatmaps.
First let us get some clusterings for ALPNs and TONs based on their cross-correlation.
# TON correlation matrix
cor.mat = lsa::cosine(conn.mat.scaled)

# ALPN correlation matrix
cor.mat.2 = lsa::cosine(t(conn.mat.scaled))

# Grey tone for heatmap
heatmap.cols = circlize::colorRamp2(c(-1, -0.5, -0.25, 0, 0.25, 0.5, 1),
                     c(
                       hemibrain_bright_colors[["navy"]],
                       hemibrain_bright_colors[["blue"]],
                       hemibrain_bright_colors[["cyan"]],
                       "grey90",
                       hemibrain_bright_colors[["yellow"]],
                       hemibrain_bright_colors[["orange"]],
                       hemibrain_bright_colors[["cerise"]])
)


# dendrogram colours
apricot = colorRampPalette(LaCroixColoR::lacroix_palette("Apricot"))

# clustering
cclus =  dendroextras::color_clusters(hclust(as.dist(1-cor.mat), method = "ward.D2"), h = 0.1, col = apricot)
rclus =  dendroextras::color_clusters(hclust(as.dist(1-cor.mat.2), method = "ward.D2"), h = 0.1, col = apricot)
Plot dendrograms:
We can see what our data like quickly, by plotting some simple heatmaps:
# Normalised matrix
heatmap.2(x = conn.mat.scaled, Rowv = rclus, Colv= cclus,
          trace="none", na.color = "darkgrey", scale="none",
          density.info = "none", key = TRUE, symkey=FALSE,
          srtCol=0, srtRow  = 0)

# Correlation matrix for TONs
heatmap.2(x = cor.mat, Rowv = cclus, Colv= cclus,
          trace="none", na.color = "darkgrey", scale="none",
          density.info = "none", key = TRUE, symkey=FALSE,
          srtCol=0, srtRow  = 0)

# Correlation matrix for ALPNs
heatmap.2(x = cor.mat.2, Rowv = rclus, Colv= rclus,
          trace="none", na.color = "darkgrey", scale="none",
          density.info = "none", key = TRUE, symkey=FALSE,
          srtCol=0, srtRow  = 0)
And now we can fully annotate our data with a more complex heatmap:
# columns annotations
ton.compartment = ifelse(grepl("axon",colnames(conn.mat.scaled)),"axon","dendrite")
cts = gsub("_axon$|_dendrite$","",colnames(conn.mat.scaled))
ton.layers = paste0("layer_",ton.info[match(cts,ton.info$cell_type),"ct.layer"])
ton.layers[ton.layers=="layer_NA"] = NA
ton.transmitter = ton.info[match(cts,ton.info$cell_type),"putative.classic.transmitter"]
ton.transmitter[ton.transmitter=="unknown"] = NA
ton.transmitter[ton.transmitter=="acetlcholine"] = "acetylcholine"
ton.class = ton.info[match(cts,ton.info$cell_type),"class"]
ton.class[ton.class=="LHN"] = "LHON"
ha = HeatmapAnnotation(
  df = data.frame(class = ton.class,
                  layer = ton.layers,
                  transmitter = ton.transmitter,
                  compartment = ton.compartment),
   annotation_height = unit(4, "mm"),
  col = list(class = paper_colours, layer = paper_colours, transmitter = paper_colours, compartment = paper_colours),
  na_col = "white"
)

# Row annotations
pn.class = pn.info[match(rownames(conn.mat.scaled),pn.info$cell_type),"class"]
pn.class[pn.class=="biPN"] = "mPN"
pn.class[is.na(pn.class)] = "mPN"
pn.neurotransmitter = pn.info[match(rownames(conn.mat.scaled),pn.info$cell_type),"neurotransmitter"]
pn.ct.layer = as.character(pn.info[match(rownames(conn.mat.scaled),pn.info$cell_type),"ct.layer"])
pn.os = pn.info[match(rownames(conn.mat.scaled),pn.info$cell_type),"odour_scenes"]
pn.os = strsplit(pn.os,"/")
pn.os = sapply(pn.os, sort)
pn.os.1  = sapply(pn.os, function(x) hemibrainr:::nullToNA(x[1]))
pn.os.2  = sapply(pn.os, function(x) hemibrainr:::nullToNA(x[2]))
pn.os.3  = sapply(pn.os, function(x) hemibrainr:::nullToNA(x[3]))
ha2 = HeatmapAnnotation(
  df = data.frame(class = pn.class,
                  layer = pn.ct.layer,
                  transmitter = pn.neurotransmitter,
                  modality.1 = pn.os.1,
                  modality.2 = pn.os.2,
                  modality.3 = pn.os.3),
   annotation_height = unit(4, "mm"),
  col = list(class = paper_colours,
             layer = paper_colours,
             transmitter = paper_colours,
             modality.1 = paper_colours,
             modality.2 = paper_colours,
             modality.3 = paper_colours),
  na_col = "white"
)

# Plot complex heatmap!
pdf("ALPN_TOON_normalised_connectivity.pdf", height = 14, width = 9)
Heatmap(conn.mat.scaled,
        split = 10,
        name = " ",
        cluster_rows = rclus,
        cluster_columns = cclus,
        top_annotation = ha,
        show_row_names = FALSE,
        show_column_names = FALSE,
        col = heatmap.cols,
        heatmap_legend_param = list(by_row = TRUE, ncol = 1, legend_direction = "vertical", grid_width = unit(2, "mm")),
        row_title_gp = gpar(fontsize = 14, fontfamily  ="Helvetica"),
        column_title_gp = gpar(fontsize = 14, fontfamily  ="Helvetica"),
        row_names_gp = gpar(fontsize = 12, fontfamily  ="Helvetica"),
        column_names_gp = gpar(fontsize = 12, fontfamily  ="Helvetica")) +
Heatmap(pn.class, name = "class", width = unit(5, "mm"), col = paper_colours, na_col = "white",
        row_title_gp = gpar(fontsize = 14, fontfamily  ="Helvetica"),
        column_title_gp = gpar(fontsize = 14, fontfamily  ="Helvetica"),
        column_names_gp = gpar(fontsize = 12, fontfamily  ="Helvetica")) +
Heatmap(pn.ct.layer, name = "layer", width = unit(5, "mm"), col = paper_colours, na_col = "white",
        row_title_gp = gpar(fontsize = 14, fontfamily  ="Helvetica"),
        column_title_gp = gpar(fontsize = 14, fontfamily  ="Helvetica"),
        column_names_gp = gpar(fontsize = 12, fontfamily  ="Helvetica")) +
Heatmap(pn.os.1, name = "modality.1", width = unit(5, "mm"), col = paper_colours, show_row_names = FALSE, na_col = "white",
        row_title_gp = gpar(fontsize = 14, fontfamily  ="Helvetica"),
        column_title_gp = gpar(fontsize = 14, fontfamily  ="Helvetica"),
        column_names_gp = gpar(fontsize = 12, fontfamily  ="Helvetica")) +
Heatmap(pn.os.2, name = "modality.2", width = unit(5, "mm"), col = paper_colours, show_row_names = FALSE, na_col = "white",
        row_title_gp = gpar(fontsize = 14, fontfamily  ="Helvetica"),
        column_title_gp = gpar(fontsize = 14, fontfamily  ="Helvetica"),
        column_names_gp = gpar(fontsize = 12, fontfamily  ="Helvetica")) +
Heatmap(pn.os.3, name = "modality.3", width = unit(5, "mm"), col = paper_colours, show_row_names = FALSE, na_col = "white",
        row_title_gp = gpar(fontsize = 14, fontfamily  ="Helvetica"),
        column_title_gp = gpar(fontsize = 14, fontfamily  ="Helvetica"),
        column_names_gp = gpar(fontsize = 12, fontfamily  ="Helvetica"))
dev.off()
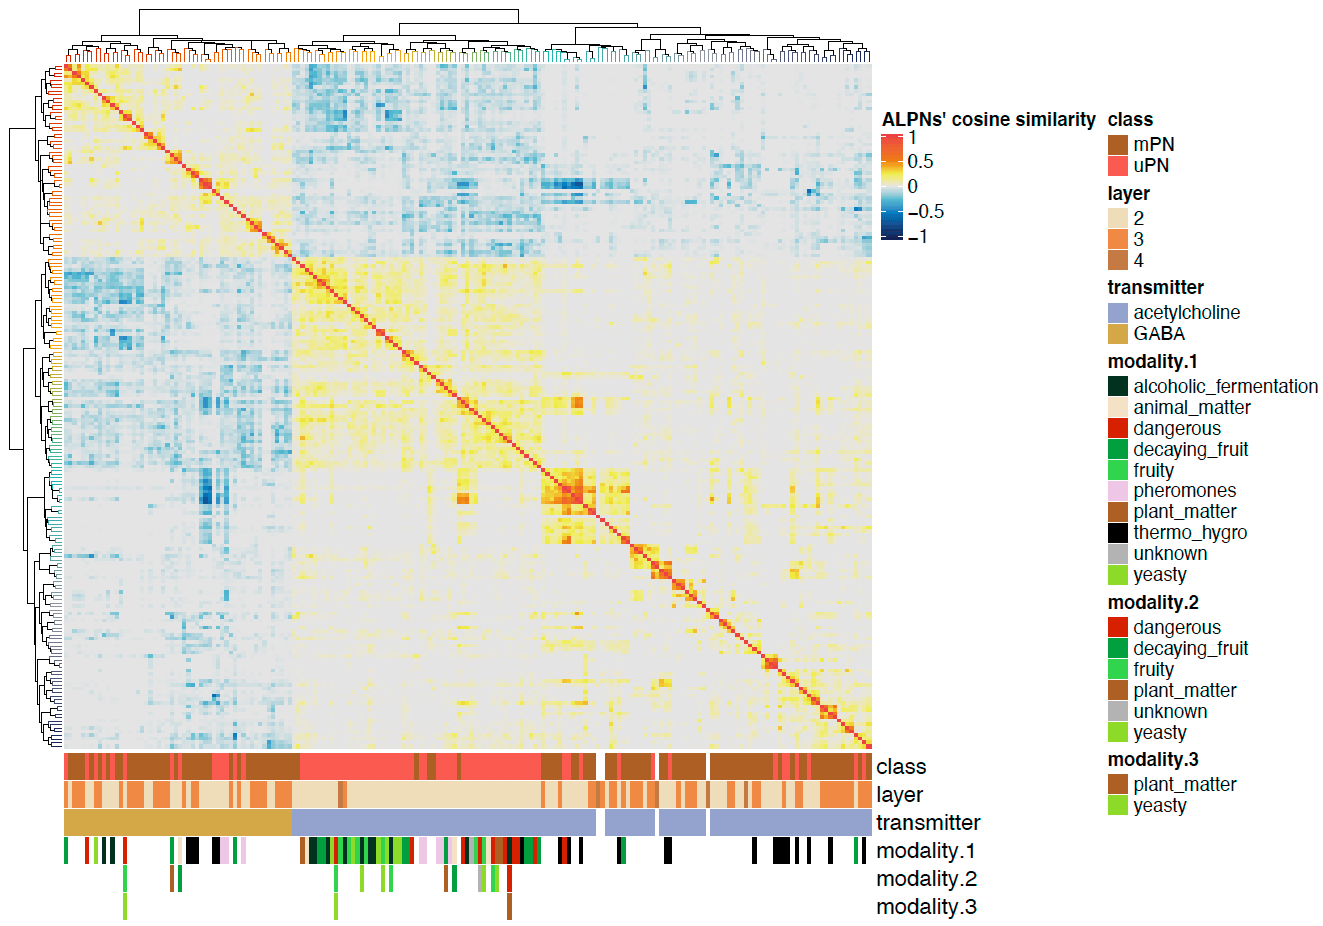
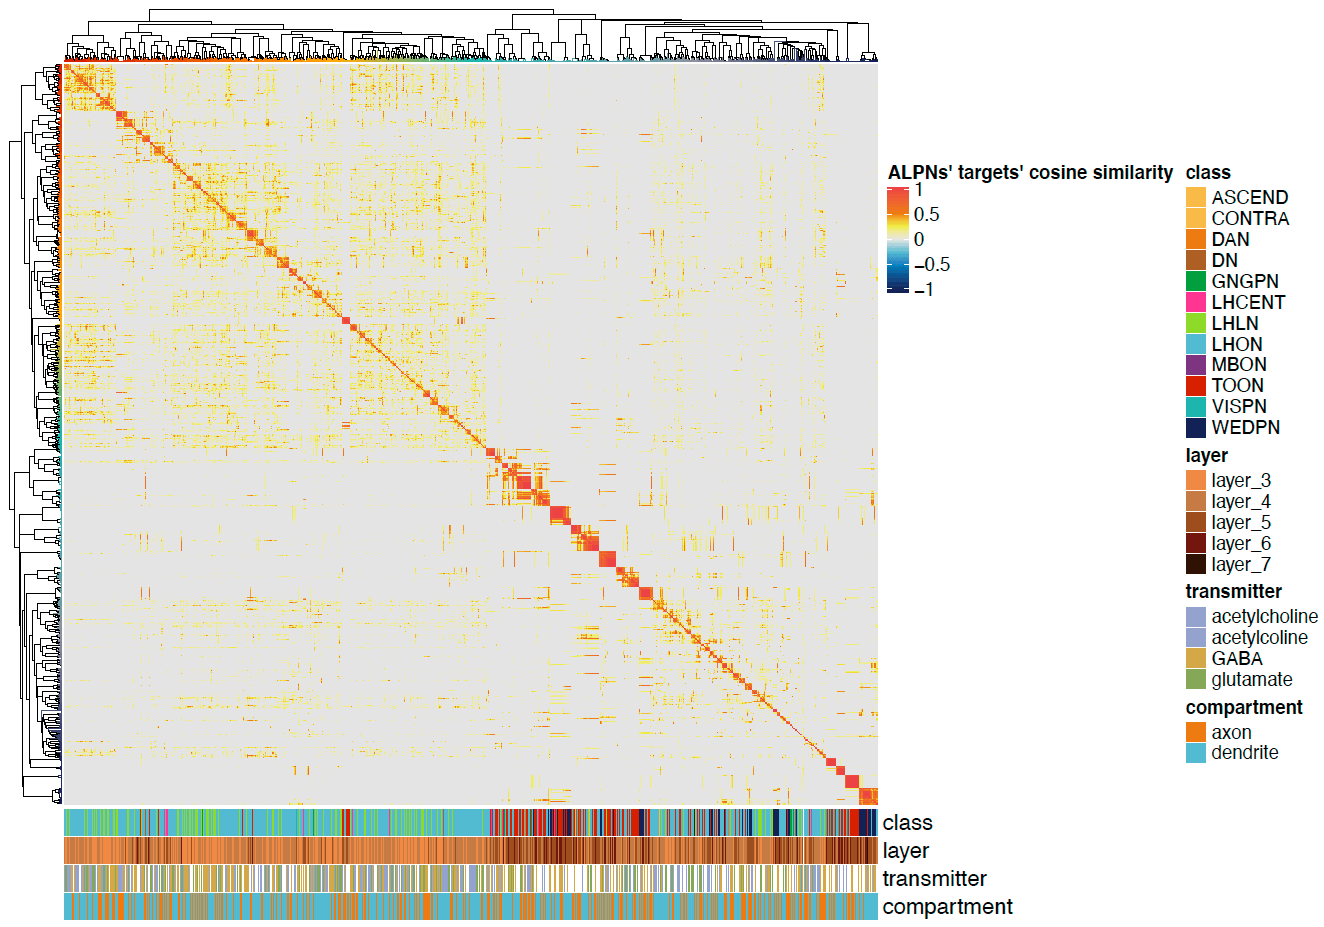
We can also plot the correlation heatmaps.
# Plot for TONs
pdf("ALPN_to_TOON_crosscorrelation_TOONs.pdf", height = 7, width = 10)
Heatmap(cor.mat,
        name = "ALPNs' targets' cosine similarity",
        split = NULL,
        cluster_rows = cclus,
        cluster_columns = cclus,
        bottom_annotation = ha,
        show_row_names = FALSE,
        show_column_names = FALSE,
        col = heatmap.cols,
        row_title_gp = gpar(fontsize = 14, fontfamily  ="Helvetica"),
        column_title_gp = gpar(fontsize = 14, fontfamily  ="Helvetica"),
        row_names_gp = gpar(fontsize = 12, fontfamily  ="Helvetica"),
        column_names_gp = gpar(fontsize = 12, fontfamily  ="Helvetica"))
dev.off()

# Plot for ALPNs
pdf("ALPN_to_TOON_crosscorrelation_ALPNs.pdf", height = 7, width = 10)
Heatmap(cor.mat.2,
        name = "ALPNs' cosine similarity",
        split = NULL,
        cluster_rows = rclus,
        cluster_columns = rclus,
        bottom_annotation = ha2,
        show_row_names = FALSE,
        show_column_names = FALSE,
        col = heatmap.cols,
        row_title_gp = gpar(fontsize = 14, fontfamily  ="Helvetica"),
        column_title_gp = gpar(fontsize = 14, fontfamily  ="Helvetica"),
        row_names_gp = gpar(fontsize = 12, fontfamily  ="Helvetica"),
        column_names_gp = gpar(fontsize = 12, fontfamily  ="Helvetica")
)
dev.off()
